
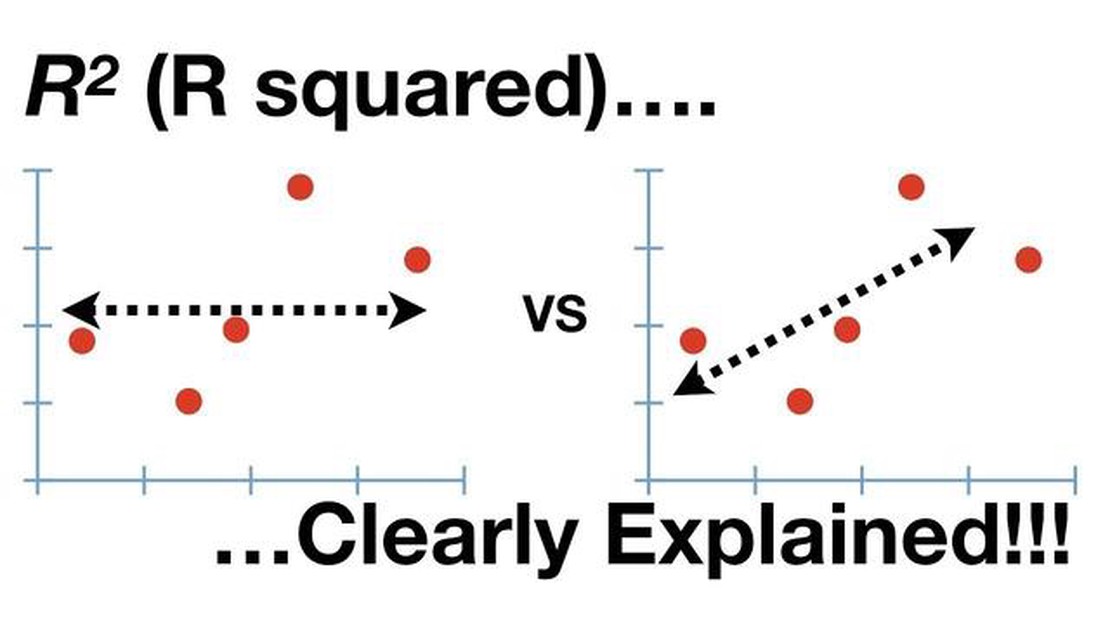

Understanding the Meaning of an R-squared Value of 0.5
Understanding the Significance of an R-squared Value of 0.5 When analyzing data, one common statistical measure used is the R-squared value. The …
Read Article

The Bollinger Bands are a popular technical analysis tool used by traders and investors to identify potential price breakouts and reversals in the stock market. Developed by John Bollinger in the 1980s, the bands consist of three lines plotted on a price chart: a simple moving average (SMA) line in the middle, and an upper and lower band that represent two standard deviations above and below the SMA line, respectively.
When a stock price crosses above the upper Bollinger Band, it is considered a bullish signal and indicates that the stock is overbought. This means that the stock’s price has risen to a level that is not sustainable in the short term, and a pullback or reversal in price is likely to occur. Traders and investors may interpret this as an opportunity to sell their positions or place short trades, expecting the price to decline in the near future.
However, it’s important to note that a stock price crossing above the upper Bollinger Band does not guarantee an immediate reversal in price. The band acts as a volatility indicator, and an upward price move beyond the band suggests that the stock is experiencing increased volatility and momentum. In some cases, the price may continue to rise or consolidate near the upper band before reversing. Traders should consider other technical indicators and market conditions to confirm the signal provided by the Bollinger Bands.
Furthermore, crossing above the upper Bollinger Band can also be seen as a positive sign for long-term investors. It indicates strong buying pressure and potential upward momentum in the stock. Investors may choose to hold onto their positions or consider adding to their holdings, expecting further price appreciation. However, as with any investment decision, thorough research and analysis are crucial to understanding the underlying fundamentals and evaluating the potential risks involved.

When a stock price crosses above the upper Bollinger Band, it is considered a significant event in technical analysis. The Bollinger Bands are a popular tool used by traders to assess the volatility and potential continuation or reversal of price trends.
The upper Bollinger Band is calculated by adding two standard deviations to the moving average of the stock price over a specified period. It represents the upper boundary of the expected price range based on historical volatility.
When the stock price rises above the upper Bollinger Band, it suggests that the price has moved beyond the expected range and may be overbought. This indicates a potentially overextended price movement and signals the possibility of a price reversal or correction.
Read Also: 20 day EMA: Understanding the 20-day Exponential Moving Average
Traders and investors closely monitor the crossing of the stock price above the upper Bollinger Band as it can act as a signal to adjust their trading strategy. If a stock price breaks above the upper band, it may indicate a bullish trend and provide an opportunity for traders to enter a long position or increase their existing holdings.
However, it is important to note that a stock price crossing above the upper Bollinger Band alone is not a guarantee of a sustained price increase or a buy signal. Other technical indicators and fundamental analysis should be considered to confirm the potential uptrend.
Furthermore, the significance of a stock price crossing above the upper Bollinger Band may vary depending on the timeframe and the overall market conditions. It is crucial for traders to analyze the broader market trends and consider the risk-reward ratio before making any trading decisions based on this event.
In conclusion, the crossing of a stock price above the upper Bollinger Band represents a potential change in the price trend. It is an important event that alerts traders and investors to reassess their positions and adjust their trading strategies accordingly. Proper analysis and consideration of other factors are required to make informed trading decisions based on this phenomenon.
Bollinger Bands are a popular technical analysis tool used by traders and investors to understand price volatility and identify potential price reversals. Developed by John Bollinger in the 1980s, Bollinger Bands consist of three lines: a middle line and two outer bands.
The middle line is a simple moving average (SMA) that represents the average price over a specific period. The two outer bands are calculated based on the standard deviation of price from the middle line. The standard deviation measures the dispersion of prices around the mean, indicating the level of volatility.
The standard deviation is multiplied by a factor (typically 2) and added/subtracted to/from the middle line to form the upper and lower bands. The distance between the upper and lower bands widens or narrows based on the level of volatility. When volatility is high, the bands widen, and when volatility is low, the bands narrow.
Bollinger Bands are widely used to identify overbought and oversold conditions in a security. When the price touches or crosses above the upper band, it is considered overbought, suggesting that the security is potentially overvalued and due for a price correction. Conversely, when the price touches or crosses below the lower band, it is considered oversold, suggesting that the security is potentially undervalued and due for a price rebound.
Read Also: When to Use Exponential Moving Averages: Finding the Ideal Period
Traders and investors also use Bollinger Bands to spot potential price trends and reversals. When the price moves outside of the bands, it may indicate a breakout or a trend reversal. A move above the upper band suggests a bullish trend, while a move below the lower band suggests a bearish trend. Traders often look for confirmation signals, such as volume spikes or candlestick patterns, to validate these potential price movements.
It is important to note that Bollinger Bands are not foolproof indicators and should be used in conjunction with other technical analysis tools and indicators. While they can provide valuable insights into price volatility and potential reversals, false signals can occur. Therefore, it is essential to consider other factors, such as market conditions, fundamental analysis, and risk management strategies, when making trading decisions based on Bollinger Bands.
When a stock price crosses above the upper Bollinger band, it is considered a bullish signal. This indicates that the stock’s price has risen above the average volatility level over the specified period of time. It suggests that the stock is experiencing strong upward momentum and could continue to climb in the near term.

The upper Bollinger band is calculated by adding twice the standard deviation of the stock’s price over a specified period of time to the stock’s moving average. The standard deviation measures the volatility or dispersion of the stock’s price. The upper Bollinger band is used to identify the upper boundary or resistance level of the stock’s price movement.
When a stock price crosses above the upper Bollinger band, it suggests that the stock is in a period of high volatility and upward momentum. Traders and investors may interpret this as a signal to buy the stock, anticipating further upward price movement. However, it is important to consider other technical indicators and analyze the overall market conditions before making any trading decisions.
No, it is not always a good time to buy a stock when its price crosses above the upper Bollinger band. Although this event indicates bullish momentum, it should be taken into consideration along with other factors such as volume, market trend, and fundamental analysis. It is important to conduct thorough research and analysis before making any investment decisions.

Understanding the Significance of an R-squared Value of 0.5 When analyzing data, one common statistical measure used is the R-squared value. The …
Read Article
Trading DAX: Is it Easy or Challenging? Trading the DAX, Germany’s leading stock market index, has become a popular choice among traders worldwide. …
Read Article
Understanding SL in Forex Trading: A Comprehensive Guide Stop Loss (SL) is a crucial concept in forex trading that every trader needs to understand. …
Read Article
Forex Market Size in 2023: A Comprehensive Overview The foreign exchange, or forex, market is an essential part of the global financial landscape. …
Read Article
Can you make an 83 B election on incentive stock options? Incentive Stock Options (ISOs) can be a valuable tool for employees to participate in the …
Read Article
Quick Ways to Earn 500 Coins in Dragon Adventures Dragon Adventures is an exciting game where players get to explore a magical world filled with …
Read Article

