


Salary of Costco's CFO: How Much Does the CFO of Costco Make?
Salary of the CFO of Costco: How Much Do They Make? Curious about the salary of Costco’s Chief Financial Officer (CFO)? You’re not alone. As one of …
Read Article
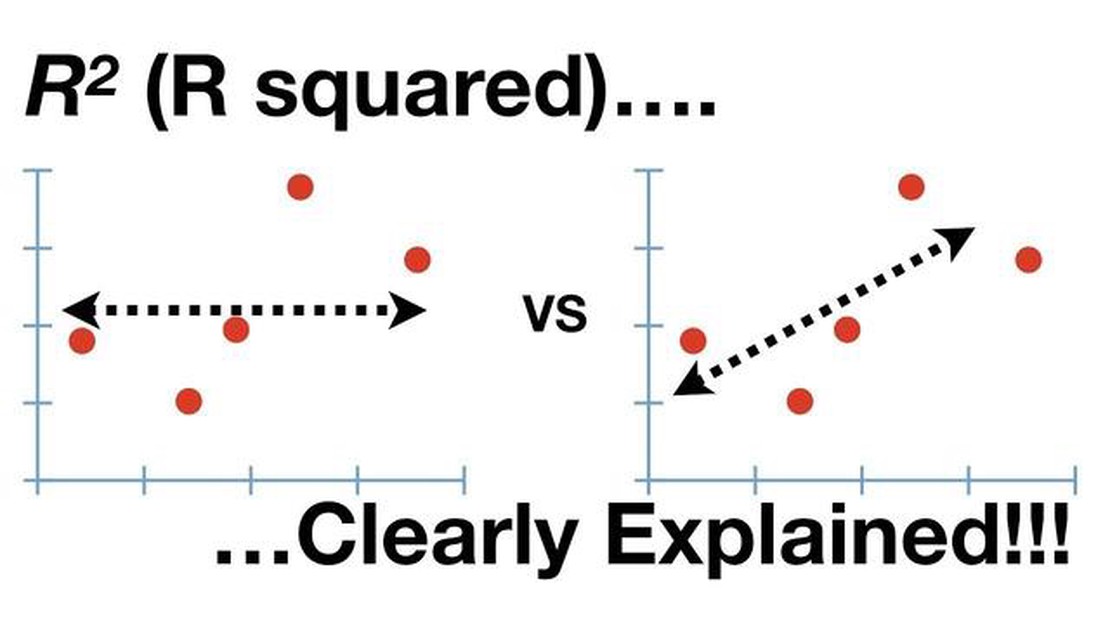
When analyzing data, one common statistical measure used is the R-squared value. The R-squared value, also known as the coefficient of determination, is a statistical measure that indicates the proportion of variability in the dependent variable that can be explained by the independent variable(s). It ranges from 0 to 1, where 0 indicates no relationship and 1 indicates a perfect relationship.
A commonly encountered scenario is when the R-squared value is 0.5. This value indicates that 50% of the variability in the dependent variable can be explained by the independent variable(s) being considered. In other words, the independent variable(s) explain half of the variation in the dependent variable. However, it is important to note that a value of 0.5 does not necessarily imply a strong relationship.
While an R-squared value of 0.5 may be considered moderate, it is important to interpret it in the context of the specific analysis and field of study. In some fields, such as social sciences or economics, an R-squared value of 0.5 may be considered quite high, indicating a meaningful relationship. However, in other fields, such as physics or engineering, an R-squared value of 0.5 may be considered relatively low, suggesting that there are other factors influencing the dependent variable.
It is also worth noting that the interpretation of an R-squared value should always be accompanied by other statistical measures and considerations. For example, it is important to assess the statistical significance of the relationship and to consider potential confounding variables. Additionally, the R-squared value should be interpreted in light of the specific goals and context of the analysis, as it may differ depending on the research question or the desired level of prediction.
In conclusion, an R-squared value of 0.5 indicates that half of the variability in the dependent variable can be explained by the independent variable(s) being considered. However, its interpretation and significance depend on the specific field of study, other statistical measures, and the research goals. It is essential to consider these factors to understand the meaning and implications of an R-squared value of 0.5 properly.
The R-squared value, also known as the coefficient of determination, is a statistical measure that represents the proportion of the variance in the dependent variable that can be explained by the independent variable(s). It ranges from 0 to 1, where a value of 0 indicates that the independent variable does not explain any of the variance in the dependent variable, and a value of 1 indicates that the independent variable explains all of the variance.
When the R-squared value is 0.5, it means that 50% of the variance in the dependent variable can be explained by the independent variable(s). This indicates a moderate strength of the relationship between the variables. However, it does not imply that the relationship is strong or conclusive. Other factors, such as the sample size and the specific nature of the data, should be taken into consideration when interpreting the R-squared value.

It is important to note that the R-squared value alone does not provide information about the direction or nature of the relationship between the variables. A positive R-squared value indicates a positive relationship, where an increase in the independent variable is associated with an increase in the dependent variable. Conversely, a negative R-squared value indicates a negative relationship, where an increase in the independent variable is associated with a decrease in the dependent variable. A value of 0 suggests no relationship between the variables.
In addition to the R-squared value, it is common to use other statistical measures, such as the p-value and the adjusted R-squared, to assess the significance and reliability of the relationship between the variables. The p-value indicates the probability of observing the relationship by chance alone, and a low p-value suggests a significant relationship. The adjusted R-squared adjusts the R-squared value for the number of independent variables and provides a more conservative estimate of the explanatory power of the model.
Read Also: Discovering the Quantum Indicator: What You Need to Know
Overall, while the R-squared value can provide a useful summary measure of the strength of the relationship between variables, it should be interpreted in conjunction with other statistical measures and the context of the specific analysis.
The R-squared value is a statistical measure that represents the proportion of the variance in a dependent variable that can be explained by the independent variables in a regression model. It is an important tool in statistics as it provides useful insights into the quality of a regression model and the strength of the relationship between the independent and dependent variables.
One of the main uses of the R-squared value is to assess the goodness-of-fit of a regression model. A high R-squared value, close to 1, indicates that a large proportion of the variance in the dependent variable is explained by the independent variables in the model. This suggests that the model provides a good representation of the relationship between the variables.
On the other hand, a low R-squared value, close to 0, indicates that the independent variables have little explanatory power in the model and that the model does not capture the relationship between the variables accurately. In such cases, it may be necessary to consider other variables or alternative models that better explain the data.
The R-squared value can also be used to compare different regression models. By comparing the R-squared values of different models, it is possible to determine which model provides a better fit to the data. This can be particularly useful in situations where there are multiple models to choose from or when making predictions based on the regression model.
Furthermore, the R-squared value can provide insights into the reliability of the estimated coefficients in the regression model. A high R-squared value indicates that the estimated coefficients are more reliable and have a stronger relationship with the dependent variable. Conversely, a low R-squared value suggests that the estimated coefficients may be less reliable and have a weaker relationship with the dependent variable.
Read Also: Understanding Sniper Entry in Crypto: How It Works and Its Potential Impact
In conclusion, the R-squared value is an important statistical measure that helps assess the quality of a regression model, compare different models, and understand the relationship between the independent and dependent variables. It provides insights into the goodness-of-fit of the model and helps determine the reliability of the estimated coefficients. Understanding the importance of R-squared in statistics is crucial for conducting meaningful analyses and making informed decisions based on regression models.
An R-squared value is a statistical measure that represents the proportion of the variance in a dependent variable that can be explained by the independent variables in a regression model. It ranges from 0 to 1, where 0 indicates that the independent variables have no explanatory power, and 1 indicates that they can fully explain the variability in the dependent variable.

An R-squared value of 0.5 means that 50% of the variance in the dependent variable can be explained by the independent variables in the regression model. This suggests that the model has moderate predictive power and the independent variables are moderately effective in explaining the variability in the dependent variable.
Whether an R-squared value of 0.5 is good or bad depends on the context and the field of study. In some fields, such as social sciences, an R-squared value of 0.5 may be considered quite high and indicative of a strong relationship between the variables. In other fields, such as physical sciences, an R-squared value of 0.5 may be considered low and indicate a need for further investigation or improvement of the model.
Yes, an R-squared value of 0.5 can be improved by considering different independent variables, adding more variables to the model, or using more sophisticated modeling techniques. Additionally, refining the data collection process or increasing the sample size can also help improve the R-squared value.
Several factors can contribute to an R-squared value of 0.5. These can include the complexity of the relationship between the variables, the presence of outliers or influential data points, the quality of the data, and the limitations of the regression model used. It is important to critically assess these factors to determine the adequacy of the model and the interpretation of the R-squared value.
An R-squared value of 0.5 means that 50% of the variation in the dependent variable can be explained by the independent variable(s).

Salary of the CFO of Costco: How Much Do They Make? Curious about the salary of Costco’s Chief Financial Officer (CFO)? You’re not alone. As one of …
Read Article
How to Draw a Trend Line Manually One of the fundamental tools in technical analysis is the trend line. A trend line is a straight line that connects …
Read Article
Best Indicator for Intraday Volume When it comes to intraday trading, volume analysis plays a crucial role in identifying potential trading …
Read Article
Foreign Exchange Dealers Association of India (FEDAI): Explained The Foreign Exchange Dealers Association of India (FEDAI) plays a crucial role in the …
Read Article
AMT for Stock Options Exercise: Everything You Need to Know When it comes to stock options, many employees are familiar with the potential for …
Read Article
Easy steps to install VWAP indicator If you’re a trader looking to enhance your technical analysis, the Volume Weighted Average Price (VWAP) indicator …
Read Article


