


Understanding Stock Vesting: An Example and Explanation
Understanding Stock Vesting: An Example and Explanation Vesting is a term that frequently pops up in discussions about employee compensation, …
Read Article
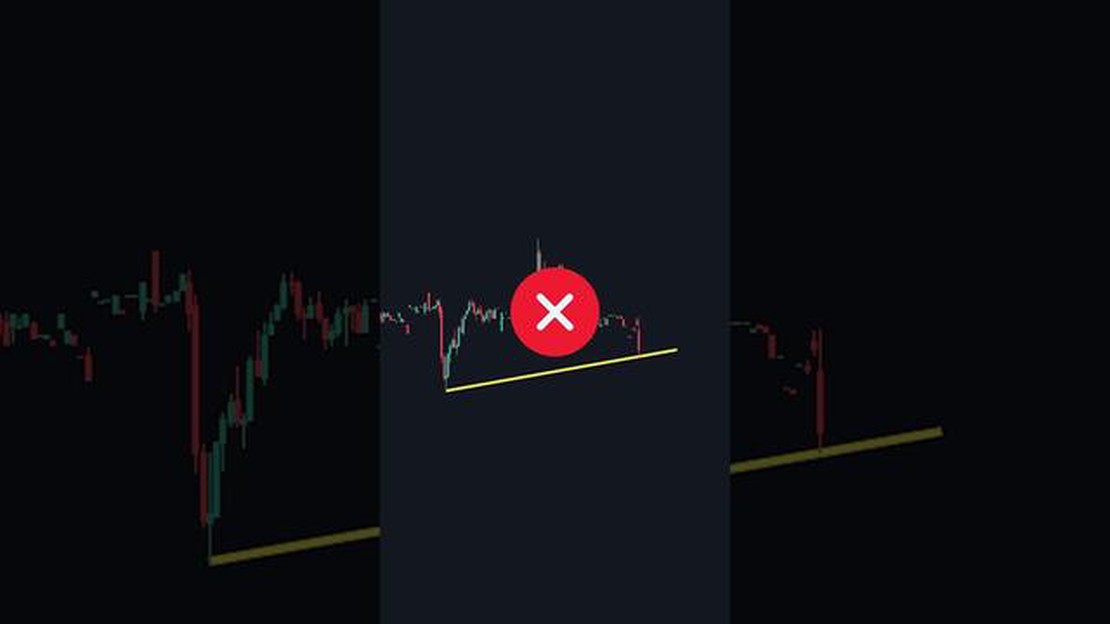
One of the fundamental tools in technical analysis is the trend line. A trend line is a straight line that connects two or more price points and is used to help identify the direction and strength of a trend in a financial market. Drawing a trend line manually can be a valuable skill for traders and investors, as it can provide important insights into potential support and resistance levels, as well as entry and exit points.
To manually draw a trend line, you need to identify at least two significant price points. These can be either swing highs or swing lows, depending on the direction of the trend you are analyzing. A swing high is a peak in price that is higher than the highs on either side, while a swing low is a trough in price that is lower than the lows on either side.
Once you have identified these price points, you can draw a trend line by connecting them with a straight line. It is important to ensure that the trend line passes through as many points as possible to confirm its validity. A trend line that connects multiple price points is considered stronger and more reliable than one that connects only a few points.
Remember to always draw your trend lines with a pencil or a drawing tool that can be easily erased or adjusted. This is because trends in financial markets are dynamic and can change over time. By regularly adjusting your trend lines, you can capture the most up-to-date trends in the market.
When drawing a trend line, it is also important to pay attention to the slope of the line. A steeper trend line indicates a stronger trend, while a flatter trend line suggests a weaker trend. The angle of the trend line can provide insights into the momentum of the market and can help traders and investors make more informed decisions.
Overall, manually drawing a trend line can be a valuable skill for traders and investors. It allows for a visual representation of the trend, helps identify potential support and resistance levels, and can provide insights into market trends and momentum. By practicing and refining this skill, you can enhance your technical analysis abilities and improve your trading strategies.

A trend line is a line drawn on a chart that connects two or more points of price movement. It is used to identify the direction and strength of a trend. Trend lines are commonly used in technical analysis to analyze the behavior of various financial markets, such as stocks, currencies, and commodities.
When drawing a trend line, it is important to connect the lows or highs of the price movement. An uptrend line is drawn by connecting two or more higher lows, indicating an upward trend. Conversely, a downtrend line is drawn by connecting two or more lower highs, indicating a downward trend.
Trend lines can help traders and investors identify potential support and resistance levels. Support levels are areas where the price tends to bounce back up, while resistance levels are areas where the price tends to reverse direction and move down.
Overall, trend lines provide valuable insights into market trends and can help traders make informed decisions about buying and selling assets. They are a simple yet powerful tool to identify and visualize the direction of a trend.
Manually drawing a trend line can be a powerful tool for technical analysis in the financial markets. While there are automated tools and indicators available to draw trend lines, doing it manually allows for a more personalized and subjective approach.
Here are a few reasons why manually drawing a trend line can be beneficial:
Read Also: Understanding Income for Child Support in California
1. Customization: By manually drawing a trend line, you have the flexibility to adjust and customize it based on your analysis and preferences. Automated tools may not always capture the nuances and specific trends that you want to highlight.
2. Accuracy: Manual drawing ensures that you have full control over the placement and angle of the trend line. This can result in a more accurate representation of the trend, helping you make better trading decisions.
Read Also: The benefits of implementing a dynamic pricing strategy
3. Understanding market dynamics: Drawing a trend line by hand forces you to carefully analyze the price action and identify significant levels of support and resistance. This process can enhance your understanding of the market dynamics and improve your ability to anticipate future price movements.
4. Identifying breakouts and reversals: Manual trend lines can help you identify potential breakout or reversal points. By observing how the price interacts with the trend line, you can gain insights into market sentiment and identify potential trading opportunities.
In conclusion, manually drawing a trend line provides traders with more customization, accuracy, and a deeper understanding of the market. While automated tools can be helpful, the personal touch and analysis involved in manual drawing can make a significant difference in your trading success.
In order to manually draw a trend line, the first step is to choose the data set that you want to analyze. This data set should be a collection of data points that represent the trend you want to analyze. It can be financial data, sales data, or any other type of data that shows a trend over time.
Once you have chosen the data set, you will need to organize it in a table format. The table should have two columns: one for the x-values (usually the time period) and one for the y-values (the data points). This allows you to easily plot the data points on a graph and draw the trend line.
Make sure that the data set is reliable and accurate. Any errors or incorrect data points can affect the accuracy of the trend line. It’s also important to have enough data points to accurately represent the trend you are analyzing. The more data points you have, the more reliable your trend line will be.

Once you have chosen and organized the data set, you are ready to move on to the next step of manually drawing a trend line.
A trend line is a straight line that connects two or more price points on a chart. It is used to identify the direction and strength of a trend in a financial market.
Drawing a trend line manually allows traders to have more control and accuracy in identifying trend reversals and potential entry or exit points in the market. It also helps to eliminate any noise or false signals that may be present when using automated trend line tools.
A trend line is a line drawn on a chart that connects two or more price points and is used to help identify the direction of the trend.

Understanding Stock Vesting: An Example and Explanation Vesting is a term that frequently pops up in discussions about employee compensation, …
Read Article
Tips to Avoid Slippage in Forex Trading Forex trading can be a highly profitable venture, but it also comes with its challenges. One of the biggest …
Read Article
Why is AED fixed to USD? For many years, the United Arab Emirates dirham (AED) has remained closely tied to the United States dollar (USD). This …
Read Article
Experience the Life of an FX Trader: Insights and Discoveries Foreign exchange (FX) trading is a thrilling and dynamic profession that has gained …
Read Article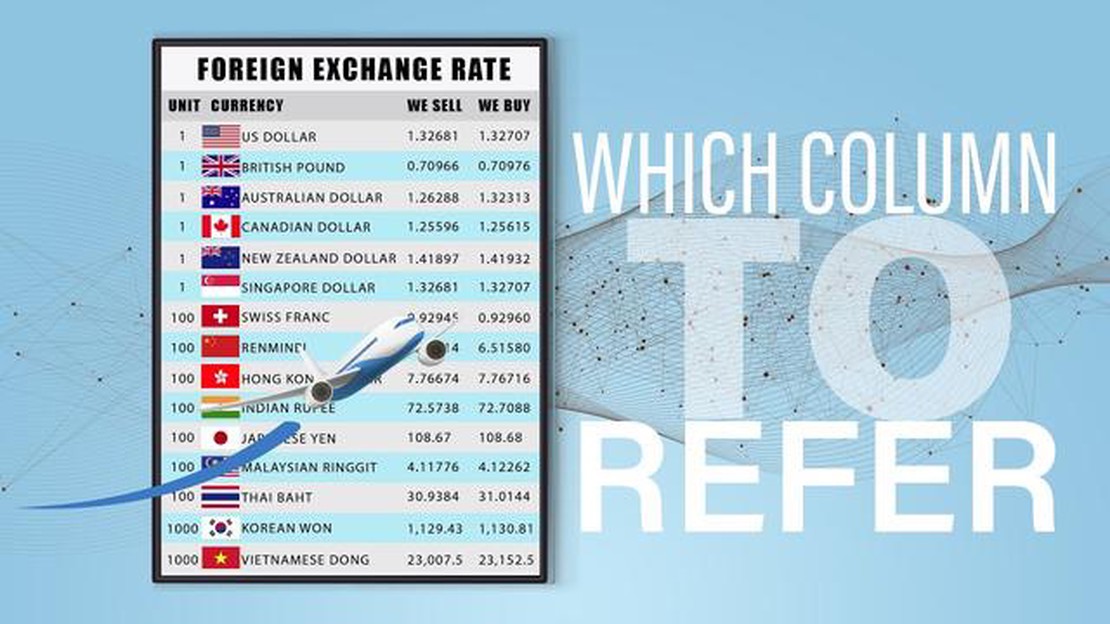
Understanding Buy and Sell in Exchange Rate When it comes to international travel or conducting business in a different currency, understanding …
Read Article
Ways to Avoid Foreign Transaction Fees at ATMs Traveling abroad can be an exciting experience, but hidden fees can quickly put a damper on your trip. …
Read Article


