
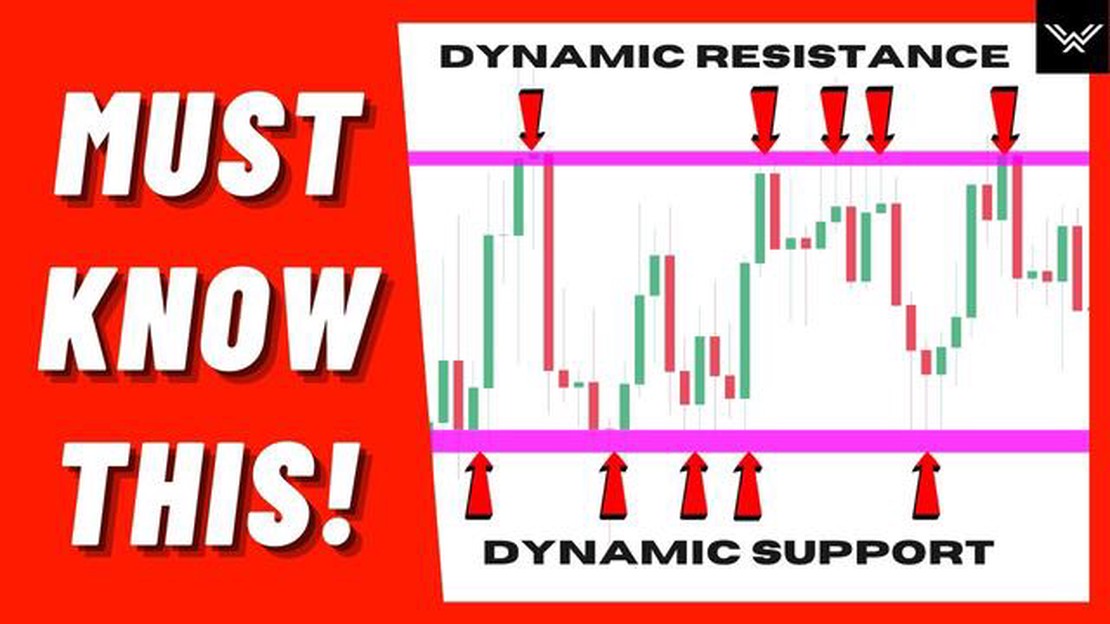

Learn How to Identify Support and Resistance in Forex Trading
How to Identify Support and Resistance in Forex Trading Support and resistance are essential concepts in forex trading. They refer to specific price …
Read Article
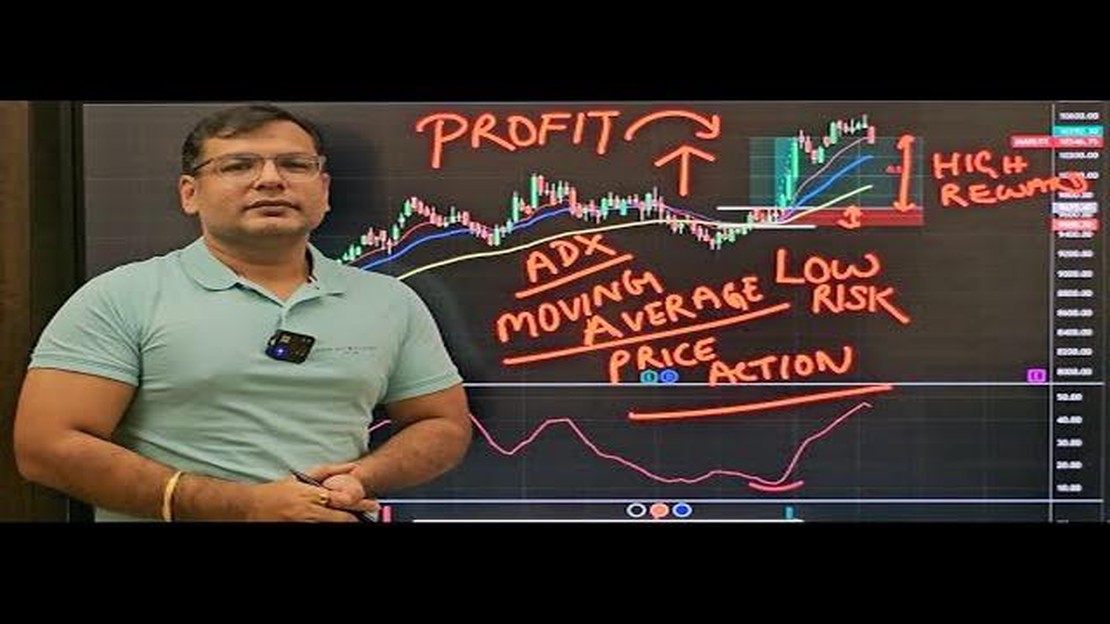
Trading in the financial markets can be a challenging task, even for experienced traders. However, by using the right tools and strategies, traders can increase their chances of success. Two popular technical indicators that traders often rely on are the Exponential Moving Average (EMA) and the Average Directional Index (ADX).
The EMA is a type of moving average that gives more weight to recent price data. This makes it more responsive to changes in price, compared to other moving averages. Traders often use the EMA to identify trends and potential entry and exit points. By plotting multiple EMAs with different time periods, traders can get a clearer picture of the overall trend.
The ADX, on the other hand, is used to measure the strength and direction of a trend. It consists of three lines - the ADX line, the +DI line, and the -DI line. The ADX line itself represents the strength of the trend, while the +DI and -DI lines provide information about the direction of the trend. Traders often look for high ADX values to confirm the presence of a strong trend.
By combining the EMA and ADX indicators, traders can create a comprehensive trading strategy. For example, a trader may look for buy signals when the price crosses above the EMA and the ADX is above a certain threshold. Conversely, a sell signal might be generated when the price crosses below the EMA and the ADX is below a certain threshold.
It is important to note that technical indicators like the EMA and ADX should not be used in isolation. They should be used in conjunction with other technical and fundamental analysis tools to make informed trading decisions. Additionally, traders should always test their strategies on historical data and practice risk management techniques in order to minimize potential losses. With the right approach and discipline, the EMA and ADX can be valuable tools for traders in their quest for consistent profits in the financial markets.
EMA (Exponential Moving Average) and ADX (Average Directional Index) are two popular technical indicators used in trading. Understanding how to use these indicators can help traders make informed decisions and improve their trading strategies.

EMA is a type of moving average that puts more weight on recent price data. It is calculated by taking the average of a specified number of periods, with more recent periods weighted higher. EMA can help identify trends and provide signals for buying or selling assets.
ADX, on the other hand, is a trend strength indicator. It measures the strength of a trend, whether it is an uptrend or a downtrend. ADX values range from 0 to 100, with higher values indicating a stronger trend. Traders can use ADX to determine whether a trend is worth trading or if it is better to stay out of the market.
When using EMA and ADX together, traders can gain valuable insights into the market’s overall direction and trend strength. Here are some key points to consider:
| EMA | ADX |
|---|---|
| EMA can help identify trends and provide entry and exit signals. | ADX can determine the strength of a trend. |
| EMA crossovers, where a shorter-term EMA crosses above or below a longer-term EMA, can signal potential entry or exit points. | When ADX is above a certain threshold (e.g., 25), it indicates a strong trend. |
| Using a combination of different EMA periods (e.g., 20-day EMA and 50-day EMA) can provide more reliable signals. | ADX can be used to filter out weak trends and focus on strong trends. |
| The slope of the EMA can indicate the strength and direction of the trend. | ADX values above 40 suggest an extremely strong trend. |
Read Also: Is Forex Trading a Form of Gambling? Unveiling the Truth
It is important for traders to combine EMA and ADX with other technical indicators and analysis tools to get a more comprehensive view of the market. These indicators should be used in conjunction with other forms of analysis, such as chart patterns and support and resistance levels.
In conclusion, EMA and ADX are valuable tools for traders looking to gauge market trends and trend strength. By understanding how to use these indicators and interpreting their signals, traders can make more informed trading decisions and improve their overall success in the market.
EMA stands for Exponential Moving Average. It is a commonly used technical indicator in trading. EMA is a type of moving average that gives more weight to the most recent price data points, making it more responsive to any changes in the market.
The EMA calculation takes into account the closing prices of a given period and applies a smoothing factor to give more importance to recent prices. The formula for calculating EMA involves calculating the simple moving average (SMA) for a specific period and then applying a multiplier to the recent closing prices, where the multiplier decreases exponentially with each day.
Read Also: Discover the Most Profitable Forex Pairs for Your Trades
EMA is used by traders to identify trends and potential price reversals in the market. It can help traders confirm whether a trend is strong or weakening. When the price is above the EMA, it is considered a bullish signal, indicating an uptrend. Conversely, when the price is below the EMA, it is seen as a bearish signal, suggesting a downtrend.
EMA is also used in conjunction with other indicators, such as the Average Directional Index (ADX), to generate trading signals and develop trading strategies. By combining EMA with ADX, traders can gain a better understanding of the market’s strength and direction.
It is important for traders to understand how to interpret EMA readings and use them effectively in their trading decisions. EMA can be adjusted to different timeframes depending on the trader’s preference and trading strategy.
In conclusion, EMA is a widely used technical indicator that helps traders analyze trends and potential price reversals in the market. It is a useful tool for generating trading signals and developing trading strategies.

EMA stands for Exponential Moving Average. It is a type of moving average that gives more weight to recent data points. In trading, EMA is used to identify trends and gauge momentum. Traders use EMA crossovers and the slope of EMA to determine entry and exit points for trades.
ADX stands for Average Directional Index. It is a technical indicator that measures the strength and direction of a trend. ADX helps traders determine whether a market is trending or not and also indicates the strength of the current trend. Traders use ADX to filter out choppy or sideways markets and focus on trending markets for better trading opportunities.
Yes, EMA and ADX can be used together in trading. EMA can be used to identify the trend and ADX can be used to confirm the strength of the trend. When EMA and ADX are used together, traders can have a better understanding of the overall trend and make more informed trading decisions.
One limitation of using EMA is that it can be prone to false signals during choppy or sideways markets. ADX, on the other hand, does not indicate the direction of the trend, only the strength. Traders should also be aware that EMA and ADX are just two tools among many in trading and should be used in conjunction with other indicators and analysis for a comprehensive trading strategy.
Some common EMA trading strategies include EMA crossover, where traders look for the EMA of a shorter period crossing above or below the EMA of a longer period to generate buy or sell signals. EMA slope can also be used to identify the strength of the trend. ADX trading strategies focus on using ADX levels to determine whether a market is trending strongly or not and then apply other indicators or methods to make trading decisions.

How to Identify Support and Resistance in Forex Trading Support and resistance are essential concepts in forex trading. They refer to specific price …
Read Article
Tips for Becoming a Forex Master The Forex market, also known as the foreign exchange market, is the largest and most liquid financial market in the …
Read Article
Understanding Stock Options for Advisors Stock options are a popular tool used by advisors to help their clients optimize their investment strategies. …
Read Article
Understanding Currency Forecasting: All You Need to Know Currency forecasting plays a crucial role in today’s global economy, as businesses and …
Read Article
Is It Possible to Issue Stock Options Below FMV? Stock options are a common form of compensation for employees, allowing them to purchase company …
Read Article
Account Management in Forex Trading: The Pros and Cons Forex trading is a high-risk, high-reward venture. It offers the potential for substantial …
Read Article


