


Foreign ETFs: A Comprehensive Guide to International Exchange-Traded Funds
Foreign ETFs: Explained and Analyzed Exchange-traded funds (ETFs) have gained popularity as a convenient and cost-effective way for investors to gain …
Read Article
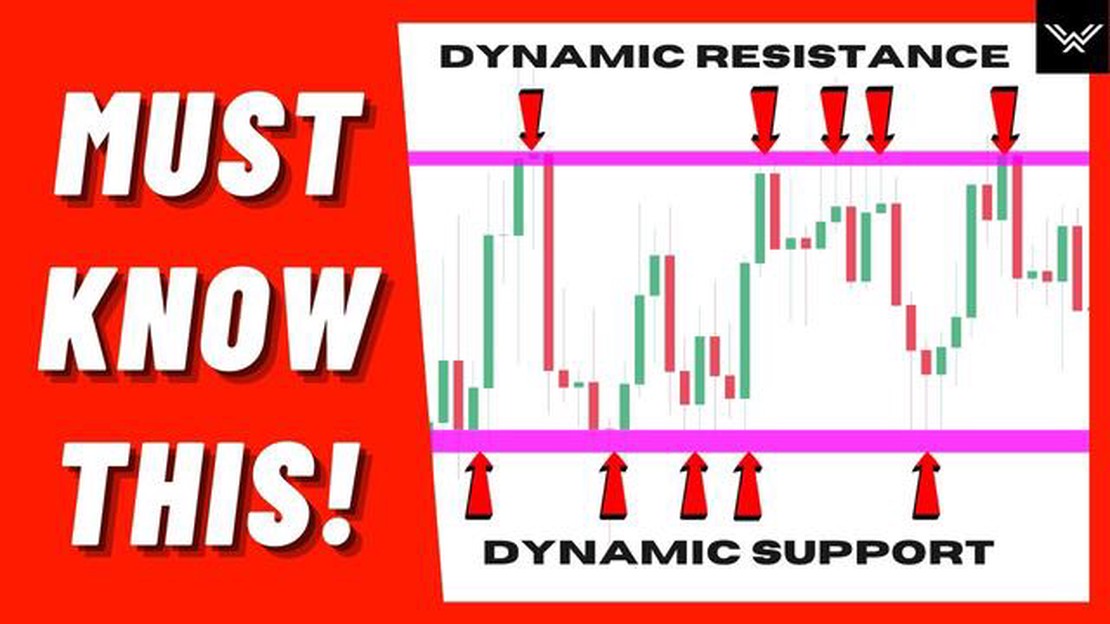
Support and resistance are essential concepts in forex trading. They refer to specific price levels on a chart, where the market tends to pause, reverse, or consolidate. Understanding how to identify these levels can greatly improve your trading decisions and increase your chances of profitability.
Support is a price level where buying interest is strong enough to overcome selling pressure. Traders expect the price to bounce back from this level, as demand for the asset increases. Resistance, on the other hand, is a price level where selling pressure is strong enough to overcome buying interest. Traders anticipate the price to reverse from this level, as supply exceeds demand.
To identify support and resistance levels, traders use technical analysis tools, such as trendlines, horizontal lines, and moving averages. Trendlines connect two or more swing lows in an uptrend or two or more swing highs in a downtrend. These lines can act as support or resistance, depending on the direction of the trend.
Horizontal lines are drawn at specific price levels, which have acted as support or resistance in the past. These levels are identified by looking for areas on the chart where the price has previously shown a significant reaction, such as reversing or consolidating. Moving averages, especially longer-term ones like the 50-day or 200-day moving average, can also act as support or resistance levels.
By identifying support and resistance levels, traders can make informed decisions about when to enter or exit trades. When the price is approaching a known support level, it may be a good opportunity to buy, as the likelihood of a bounce increases. Conversely, when the price is approaching a known resistance level, it may be a good opportunity to sell, as the likelihood of a reversal or consolidation increases.
Remember, support and resistance levels are not exact prices, but rather zones or areas where price action tends to react. It’s important to use other technical analysis tools and indicators to confirm the strength of these levels and avoid false breakouts or breakdowns.
In conclusion, learning how to identify support and resistance levels in forex trading is a critical skill for traders. These levels can help determine potential buying or selling opportunities and provide valuable insight into market dynamics. By combining this knowledge with other technical analysis tools, traders can increase their chances of successful trading in the forex market.
Support and resistance are two key concepts in forex trading that traders use to identify important levels on price charts. These levels help traders make informed trading decisions and predict potential price movements.
Support is a price level at which there is a significant amount of buying interest, causing the price to stop falling and potentially reverse direction. It acts as a floor for the price, preventing it from going lower. Traders often view support levels as opportunities to buy the currency pair, expecting the price to bounce back up from this level.
Resistance, on the other hand, is a price level at which there is a significant amount of selling interest, causing the price to stop rising and potentially reverse direction. It acts as a ceiling for the price, preventing it from going higher. Traders often view resistance levels as opportunities to sell the currency pair, expecting the price to decline from this level.

Support and resistance levels can be identified by analyzing historical price data. Traders look for areas where the price has repeatedly bounced off or reversed direction in the past. These areas represent strong support or resistance levels.
Read Also: Understanding Graded Vesting for Stock Options: A Comprehensive Guide
Support and resistance levels can also be based on psychological factors or market sentiment. For example, a round number like 1.0000 or a major economic event can act as a significant support or resistance level.
Once support and resistance levels are identified, traders can use them to make trading decisions. They may place buy orders near support levels and sell orders near resistance levels, anticipating that the price will reverse direction. These levels can also be used to set stop-loss and take-profit levels, helping traders manage their risk.
It is important to note that support and resistance levels are not exact price points. They are rather price ranges where buying or selling interest is expected to be strong. Traders often use additional technical analysis tools, such as trendlines, moving averages, or oscillators, to confirm the strength of support and resistance levels.
Support and resistance levels are important concepts in forex trading that help traders identify potential areas of buying and selling interest in the market. These levels are formed by the interaction of supply and demand, and they play a significant role in determining market trends and price movements.
Support level is the price level at which buying interest is strong enough to prevent the price from falling further. It acts as a “floor” for the price, and when it is reached, buyers tend to enter the market, creating demand and pushing the price back up. Traders often look for confirmation of a support level before making buy orders, as it indicates potential buying opportunities.
Resistance level, on the other hand, is the price level at which selling interest is strong enough to prevent the price from rising further. It acts as a “ceiling” for the price, and when it is reached, sellers tend to enter the market, creating supply and pushing the price back down. Traders often look for confirmation of a resistance level before making sell orders, as it indicates potential selling opportunities.
Support and resistance levels can be identified through various technical analysis tools and techniques. Some common methods include trend lines, horizontal lines, moving averages, and Fibonacci retracement levels. These tools help traders spot areas where price has historically reacted in the past, indicating potential areas of support or resistance.
Once support or resistance level is identified, it can act as a reference point for traders to make trading decisions. For example, if a trader sees price approaching a support level, they might consider buying, expecting the price to bounce off the support and move higher. Conversely, if price approaches a resistance level, they might consider selling, expecting the price to reverse and move lower.
Read Also: Should I pay for a flight in USD or local currency? Find out the best way to book your flights!
It is important to note that support and resistance levels are not fixed, and they can change over time as market conditions evolve. Traders need to regularly update and adjust their support and resistance levels based on new price data and market trends.

In conclusion, understanding support and resistance levels is crucial for forex traders as it helps them identify potential buying and selling opportunities in the market. By using technical analysis tools and techniques, traders can effectively identify these levels and use them as a guide for making trading decisions.
Support and resistance levels are price levels at which the price of an asset tends to find obstacles to continue moving in the same direction. Support is a level where the price tends to stop falling and start rising, while resistance is a level where the price tends to stop rising and start falling.
There are various ways to identify support and resistance levels. One common method is to look for areas where the price has reversed direction multiple times in the past. These areas indicate strong levels of support or resistance. Additionally, you can use technical indicators and chart patterns to identify these levels.
Support and resistance levels are important in forex trading because they can help traders make better trading decisions. These levels can act as potential entry points for trades, as well as provide guidance for setting stop-loss and take-profit levels. They also help traders identify potential reversal points in the market.
Yes, support and resistance levels can be broken. When a level is broken, it means that the price has moved beyond that level, indicating a potential change in the direction of the market. Breakouts can be significant trading opportunities, as they often lead to strong trends in the direction of the breakout.
When identifying support and resistance levels, it’s important to consider other factors such as the timeframe of the chart, the volume of trading at those levels, and any significant news or events that may impact the market. These factors can provide additional confirmation or invalidate potential support and resistance levels.
Support and resistance are price levels on a forex chart where the buying or selling pressure is strong enough to prevent the price from moving further in a certain direction. Support acts as a floor for the price, preventing it from falling further, while resistance acts as a ceiling, preventing it from rising further.
Support and resistance levels can be identified by looking for areas on a forex chart where the price has previously reversed or stalled multiple times. Traders often look for swing highs and swing lows, as well as horizontal lines that connect multiple peaks or troughs.

Foreign ETFs: Explained and Analyzed Exchange-traded funds (ETFs) have gained popularity as a convenient and cost-effective way for investors to gain …
Read Article
Can I exchange money at HK airport? If you’re planning a trip to Hong Kong, you may be wondering about the currency exchange options at the airport. …
Read Article
What is a VSA in trading? If you are an aspiring trader looking to gain an edge in the market, then understanding Volume Spread Analysis (VSA) is …
Read Article
Can you negotiate a stock option? Stock options can be a valuable form of compensation, allowing employees to potentially reap significant financial …
Read Article
Guide on Using the 13 48 EMA in Trading The Exponential Moving Average (EMA) is a popular technical indicator used by traders to identify trends and …
Read Article
Trading forex with zero spread: ultimate guide Forex trading is a lucrative opportunity for investors to earn profits by trading currency pairs. One …
Read Article


