

Understanding and Applying the 200 Day Moving Average Rule
Understanding the 200 Day Moving Average Rule If you’re looking to invest in the stock market, you’ve probably come across the term “200-day moving …
Read Article
When it comes to the stock market, there are certain indicators that investors use to analyze the performance of a particular stock. One such indicator is the moving average, which can provide valuable insights into the trend and direction of a stock’s price over a given period of time.
In this article, we will take a closer look at Tesla’s moving average and how it can help investors make informed decisions about buying or selling the company’s stock. We will explore the different types of moving averages, such as the simple moving average (SMA) and the exponential moving average (EMA), and discuss their strengths and weaknesses.
Additionally, we will analyze Tesla’s historical moving average data and identify any patterns or trends that may emerge. By understanding the moving average of Tesla’s stock price, investors can gain a better understanding of the stock’s overall performance and potentially make more accurate predictions about future price movements.
Whether you’re a seasoned investor or just starting out, understanding the moving average can be a useful tool in your stock analysis arsenal. By incorporating this indicator into your investment strategy, you can gain a deeper understanding of Tesla’s stock performance and increase the likelihood of making profitable investment decisions.
Note: It’s important to remember that the moving average is just one indicator among many that investors use to analyze stocks. It should not be the sole basis for making investment decisions and should be used in conjunction with other forms of analysis and research.
The moving average is a commonly used technical analysis tool that is used to smooth out price data and identify trends over a specified period of time. It is a calculation that takes the average closing price of a security or asset over a certain number of time periods and plots it on a chart. This line, known as the moving average line, helps traders and investors to identify the overall direction of the price movement and make informed decisions.

The moving average is important in technical analysis as it helps to filter out short-term price fluctuations and noise, providing a clearer picture of the underlying trend. By removing the short-term volatility, it allows traders to focus on the long-term market direction and make better trading decisions. Additionally, the moving average can act as a support or resistance level, where the price tends to bounce off or reverse its direction.
There are different types of moving averages, such as the simple moving average (SMA) and the exponential moving average (EMA). The SMA is calculated by taking the average closing price over a specified number of time periods, while the EMA gives more weight to recent prices. Traders often use multiple moving averages with different time periods to get a more comprehensive view of the market and confirm the trend.
Read Also: Everything you need to know about Euro future: trends, predictions, and analysis
Overall, the moving average is a versatile tool that plays a crucial role in technical analysis. It helps traders and investors to identify trends, determine support and resistance levels, and make better trading decisions. Understanding how to use and interpret moving averages can greatly enhance one’s ability to navigate the market and improve trading performance.
Tesla’s moving average is a key technical indicator that investors use to analyze the stock’s price trends. By calculating the average closing price over a specific period, the moving average smoothes out short-term price fluctuations and provides a clearer picture of the stock’s overall trend.
One common method of calculating the moving average is the simple moving average (SMA), which gives equal weight to all data points in the chosen period. For example, a 50-day SMA would calculate the average closing price for the past 50 trading days. This helps to identify long-term trends and potential support and resistance levels.
Another popular approach is the exponential moving average (EMA), which assigns more weight to recent data points, making it more responsive to short-term price changes. This can provide earlier signals of trend reversals and help traders spot potential entry and exit points.
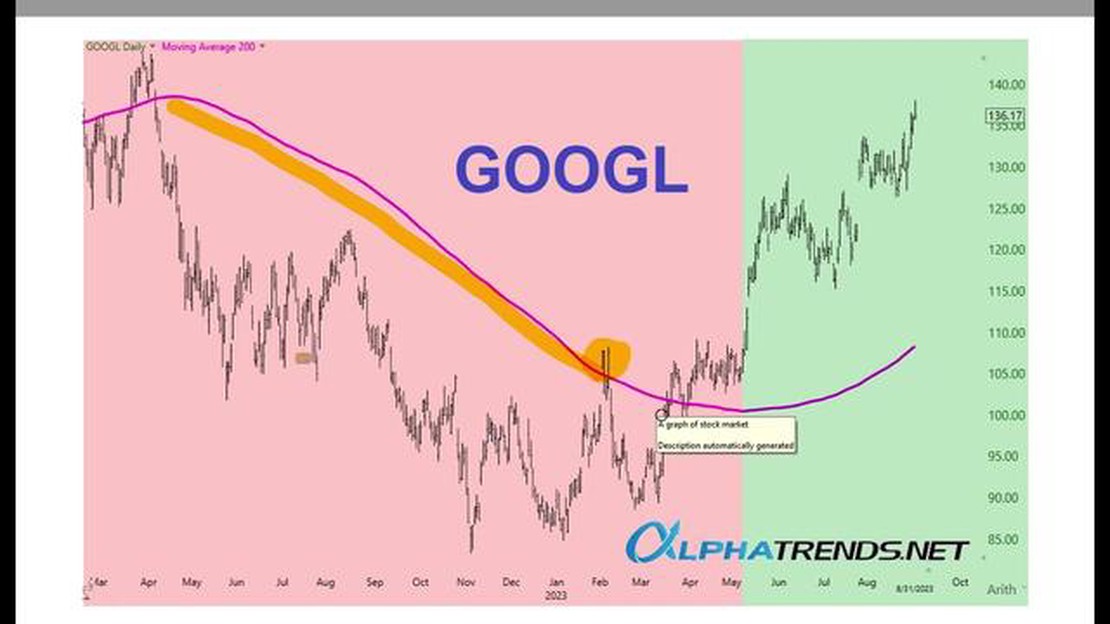
By analyzing Tesla’s moving averages, investors can gain insights into the stock’s current trend, as well as potential future price movements. For example, if the stock’s price is consistently above its moving average, it may indicate a bullish trend. On the other hand, if the price consistently falls below the moving average, it may signal a bearish trend.
Traders also look for crossovers between different moving averages to confirm trend changes. For instance, when a shorter-term moving average crosses above a longer-term moving average, it can be seen as a bullish signal. Conversely, when a shorter-term moving average crosses below a longer-term moving average, it may indicate a bearish signal.
In addition to trend analysis, moving averages can also be used to set support and resistance levels. A moving average acting as support can provide a price level where investors may consider buying, while a moving average acting as resistance can indicate a level where investors may consider selling.
| Moving Average | Calculation Method | Key Characteristics |
|---|---|---|
| Simple Moving Average (SMA) | Equal weight to all data points | Smooths out short-term fluctuations |
| Exponential Moving Average (EMA) | More weight to recent data points | Responsive to short-term changes |
Read Also: How to calculate moving average in C | Complete Guide
In conclusion, analyzing Tesla’s moving averages can provide valuable insights into the stock’s price trends and potential future movements. Traders and investors can use these indicators to make informed decisions and manage their risk accordingly.
A moving average is a statistical calculation that helps to identify trends or patterns in a set of data by smoothing out the fluctuations. It is calculated by taking the average of a specific number of data points within a given time period and moving it forward through time.

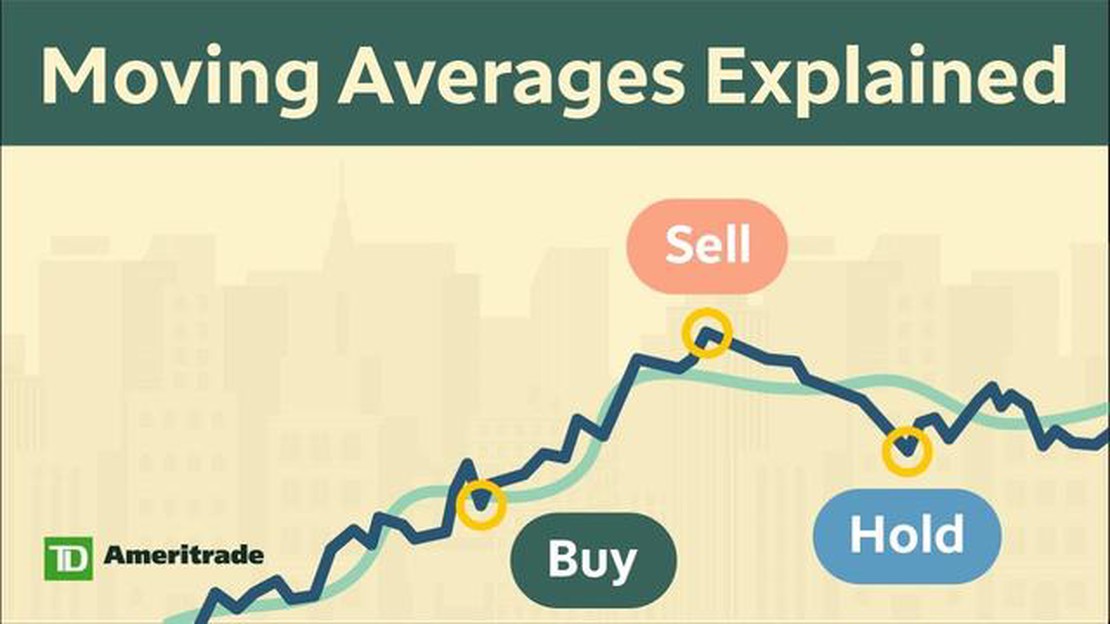
The moving average is commonly used in stock analysis to determine the overall direction of a stock’s price movement. Traders and investors look at the moving average to identify potential buy or sell signals, as well as to provide an indication of support and resistance levels.
There are several different types of moving averages that can be used, including the simple moving average (SMA), the exponential moving average (EMA), and the weighted moving average (WMA). Each type of moving average has its own way of calculating the average and placing more or less weight on recent data points.
The moving average is important for understanding Tesla’s stock performance because it provides a way to analyze the overall trend of the stock’s price movement. By looking at the moving average, traders and investors can gain insights into whether the stock is in an uptrend or a downtrend, and make more informed decisions about buying or selling Tesla shares.
Moving average crossover signals can be used in trading Tesla’s stock as a way to generate buy or sell signals. When a shorter-term moving average crosses above a longer-term moving average, it can indicate a bullish signal or a potential buying opportunity. Conversely, when a shorter-term moving average crosses below a longer-term moving average, it can indicate a bearish signal or a potential selling opportunity.
A moving average is a calculation used to analyze data over a specific time period by taking the average of a set of values over that period. It is commonly used in technical analysis to identify trends and to smooth out fluctuations.

Understanding the 200 Day Moving Average Rule If you’re looking to invest in the stock market, you’ve probably come across the term “200-day moving …
Read Article
Discover the Origins of Japanese Candlesticks The origins of Japanese candlestick charting can be traced back to 18th century Japan, where they were …
Read Article
Is Forex Titan Exchange Legit? Forex trading has become increasingly popular in recent years, attracting both seasoned traders and newcomers to the …
Read Article
Can I drop items for my friends in Diablo 3? Diablo 3 is a popular action role-playing game that allows players to embark on epic quests and battle …
Read Article
Have the Edmonton Oilers Made Any Trades? The Edmonton Oilers have been making waves in the NHL with their recent trades. Fans and analysts are …
Read Article
Best Stock Watchlist App: Top Picks for 2022 When it comes to managing your stock portfolio, having the right tools at your disposal can make all the …
Read Article


