


Reasons Why Forex Trading is Banned in the USA
Reasons for the Ban on Forex Trading in the USA Forex trading, also known as foreign exchange trading, is a global decentralized market where …
Read Article
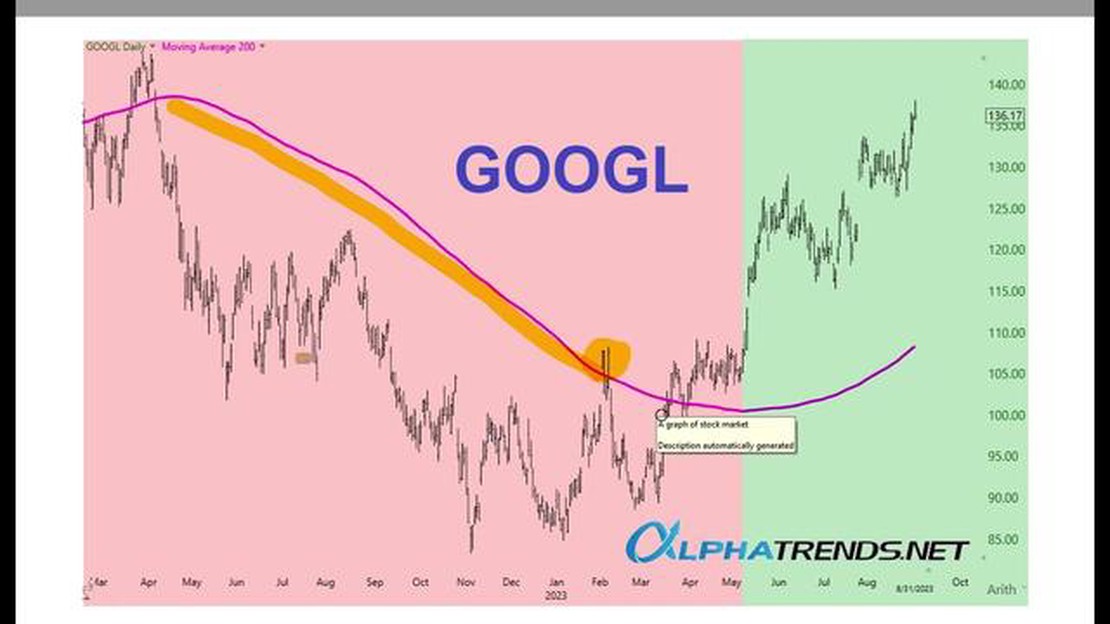
If you’re looking to invest in the stock market, you’ve probably come across the term “200-day moving average” at some point. This rule is a popular tool used by traders and investors to analyze and predict stock price trends.
The 200-day moving average is a simple yet powerful indicator that can help traders make informed decisions. Essentially, it is the average price of a stock over the past 200 trading days. By plotting this average on a chart, traders can identify the overall direction of the stock’s price movement.
When a stock’s price is above the 200-day moving average, it is considered to be in an uptrend. This indicates that the stock’s price has been consistently increasing over the long term. On the other hand, when a stock’s price is below the 200-day moving average, it is in a downtrend, suggesting that the price has been consistently decreasing.
Traders often use the 200-day moving average to determine when to buy or sell a stock. For example, when a stock’s price crosses above the 200-day moving average, it is seen as a bullish signal, indicating that the stock is likely to continue its upward trend. Conversely, when a stock’s price crosses below the 200-day moving average, it is seen as a bearish signal, suggesting that the stock may continue to decline.
The 200-day moving average is a popular technical analysis tool used by traders and investors to understand the overall trend in a stock or market. It is calculated by taking the average closing price of an asset over the past 200 trading days.
By looking at the 200-day moving average, traders can identify long-term trends and determine whether the price is currently trading above or below this average. If the price is above the 200-day moving average, it is considered bullish, indicating that the stock or market is in an uptrend. Conversely, if the price is below the 200-day moving average, it is considered bearish, indicating that the stock or market is in a downtrend.
The 200-day moving average can act as a support or resistance level. If the price approaches the 200-day moving average from below and bounces off it, it may act as a support level, indicating that the stock or market is likely to continue its uptrend. On the other hand, if the price approaches the 200-day moving average from above and fails to break through it, it may act as a resistance level, indicating that the stock or market is likely to continue its downtrend.
Traders often use the 200-day moving average in conjunction with other technical indicators and chart patterns to make more informed trading decisions. It is important to note that the 200-day moving average is not a guarantee of future price movements, but rather a tool to help traders identify potential trends and reversals.

In summary, the 200-day moving average is a widely used technical analysis tool that provides insight into the long-term trend of a stock or market. By understanding and applying the 200-day moving average rule, traders and investors can make more informed decisions and potentially profit from market movements.
The 200 day moving average is a widely used technical indicator that provides important insights into the overall trend of a stock or market. This moving average is calculated by taking the average closing price of a stock or market over the past 200 trading days.
One of the key reasons why the 200 day moving average is so important is because it helps to smooth out short-term fluctuations and noise in a stock or market’s price. By looking at the longer-term trend represented by the 200 day moving average, traders and investors can get a clearer picture of the stock’s overall direction.
When the price of a stock or market is consistently above its 200 day moving average, it is considered to be in an uptrend. This indicates that the stock has been steadily increasing in value over the long-term and is likely to continue doing so. Traders and investors may choose to buy or hold on to stocks that are above their 200 day moving average, as they are seen as more likely to continue their upward trend.
Read Also: Understanding the Mechanics of Etrade Stock Options
On the other hand, when the price of a stock or market is consistently below its 200 day moving average, it is considered to be in a downtrend. This indicates that the stock has been steadily decreasing in value over the long-term and is likely to continue doing so. Traders and investors may choose to sell or avoid stocks that are below their 200 day moving average, as they are seen as more likely to continue their downward trend.
Another reason why the 200 day moving average is important is because it acts as a support or resistance level for a stock or market. When the price of a stock is approaching its 200 day moving average from below, it often acts as a support level, providing a level of buying interest and potentially leading to a bounce in the stock’s price. On the other hand, when the price of a stock is approaching its 200 day moving average from above, it often acts as a resistance level, providing a level of selling interest and potentially leading to a decline in the stock’s price.
Read Also: Step-by-step Guide on Drawing a Wolfe Wave Pattern
In conclusion, the 200 day moving average is an important tool for traders and investors to understand and apply. By looking at the longer-term trend represented by this moving average, market participants can gain valuable insights into the overall direction and potential future movements of a stock or market. Whether used for trend identification or as a support/resistance level, the 200 day moving average is a powerful tool for making informed trading and investment decisions.
| Advantages | Disadvantages |
|---|---|
| Provides a smoother picture of the long-term trend | Can lag behind current price movement |
| Helps to filter out short-term fluctuations and noise | May not be suitable for short-term trading strategies |
| Acts as a support or resistance level | May not work well in volatile markets |
The 200 Day Moving Average Rule is a commonly used technical analysis tool that helps investors and traders identify trends in the market. By looking at the average price of a security over the past 200 trading days, traders can gain insight into the market’s momentum and make informed trading decisions.
To apply the 200 Day Moving Average Rule, follow these steps:

| Step 1: | Obtain the historical price data for the security you are interested in. This data should include the closing price for each trading day for the past 200 days. |
| Step 2: | Calculate the 200-day moving average by summing up the closing prices for the past 200 days and dividing the total by 200. |
| Step 3: | Plot the 200-day moving average on a chart along with the current price of the security. This will help you visualize the trend and identify potential buying or selling opportunities. |
| Step 4: | Monitor the relationship between the current price and the 200-day moving average. If the price is consistently above the moving average, it indicates a bullish trend. Conversely, if the price is consistently below the moving average, it indicates a bearish trend. |
| Step 5: | Use the 200-day moving average as a guide for making trading decisions. For example, if the price is above the moving average and shows signs of upward momentum, it may be a good time to buy the security. On the other hand, if the price is below the moving average and shows signs of downward momentum, it may be a good time to sell or short the security. |
It’s important to note that the 200 Day Moving Average Rule is just one tool among many in a trader’s toolbox. It should be used in conjunction with other technical indicators and fundamental analysis to make well-informed trading decisions.
By applying the 200 Day Moving Average Rule, traders can gain insight into market trends and potentially improve their trading strategies. However, it’s important to remember that past performance is not indicative of future results, and no trading strategy is foolproof.
The 200-day moving average rule is a technical analysis tool used by traders and investors to identify the overall trend of a security or market. It calculates the average price of a security over the past 200 trading days and plot it on a chart to visually represent the long-term trend.
The 200-day moving average is calculated by adding up the closing prices of a security over the past 200 trading days and dividing the sum by 200. This provides a smoothed average that reflects the long-term trend of the security.
The 200-day moving average is considered important because it is a widely recognized indicator of the long-term trend. When the price of a security is above its 200-day moving average, it is generally seen as bullish and indicates a positive trend. Conversely, when the price is below the 200-day moving average, it is considered bearish and indicates a negative trend.
Traders use the 200-day moving average in several ways. They may use it as a signal to enter or exit positions, with a buy signal being generated when the price crosses above the 200-day moving average and a sell signal being generated when it crosses below. Traders also use the 200-day moving average as a level of support or resistance, with prices often finding support near the moving average in an uptrend and resistance near it in a downtrend.

Reasons for the Ban on Forex Trading in the USA Forex trading, also known as foreign exchange trading, is a global decentralized market where …
Read Article
Can you trade forex 24 hours a day in India? The forex market is a global marketplace where currencies are exchanged. It operates 24 hours a day, five …
Read Article
Robert Kiyosaki’s Views on Forex Trading Robert Kiyosaki, the renowned American entrepreneur and author, has been a vocal advocate for financial …
Read Article
Blue Dollar Exchange Rate The blue dollar exchange rate refers to the unofficial currency exchange rate used in Argentina, which is different from the …
Read Article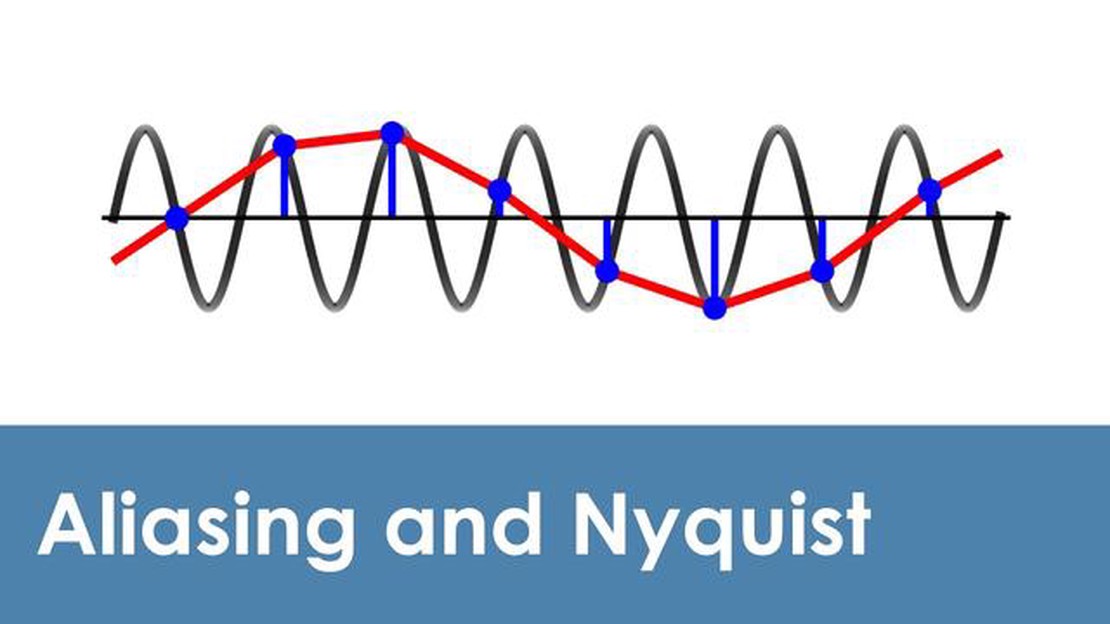
What is the Nyquist Rule for Sampling Rate? In the field of digital signal processing, the Nyquist rule plays a vital role in ensuring accurate and …
Read Article
Analyzing Options Trade: A Comprehensive Guide Options trading can be a highly profitable venture, but it can also be complex and risky. To maximize …
Read Article


