
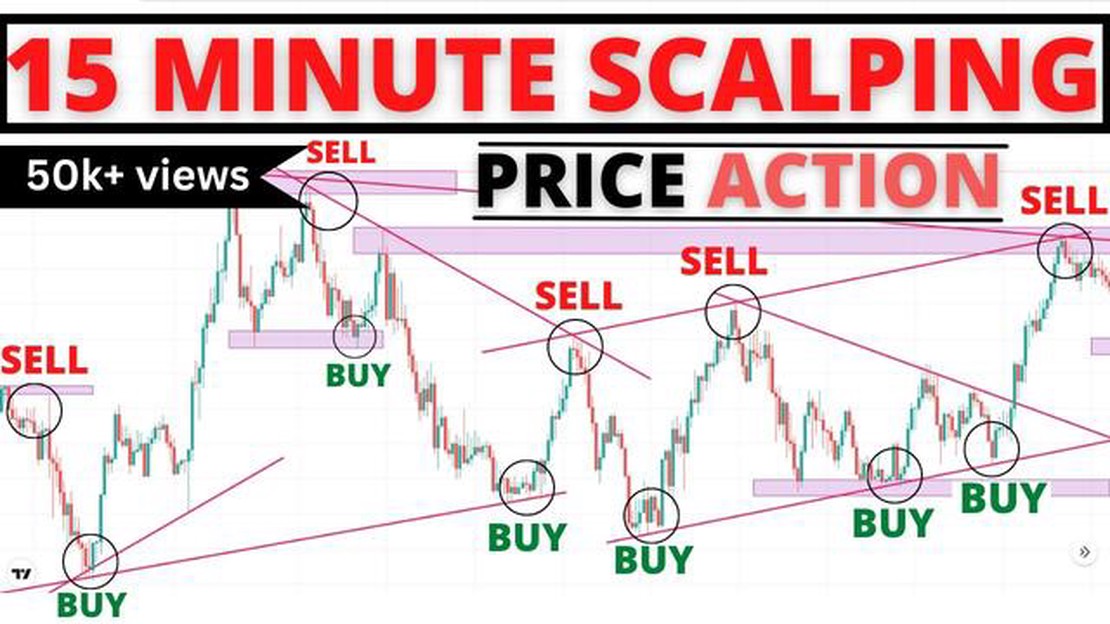

Understanding the M15 Strategy in Forex Trading: A Comprehensive Guide
Understanding the M15 Strategy in Forex Trading In the fast-paced world of forex trading, having a solid strategy is essential for success. One …
Read Article

If you are an aspiring trader looking to gain an edge in the market, then understanding Volume Spread Analysis (VSA) is crucial. VSA is a powerful tool that allows traders to analyze the relationship between volume, price, and spread in order to make informed trading decisions. In this comprehensive guide, we will delve into the principles of VSA, its key components, and how it can be effectively applied in various trading strategies.
First introduced by Richard Wyckoff and further developed by Tom Williams, VSA focuses on the study of volume patterns to decipher market behavior. The analysis of volume can reveal valuable insights such as the strength of price movements, the presence of buying or selling pressure, and the accumulation or distribution of assets. By understanding these dynamics, traders can identify potential reversals, breakouts, or trend continuations, giving them a competitive advantage in the market.
At its core, VSA involves the examination of price bars alongside volume bars. Volume bars represent the number of shares, contracts, or lots traded during a given period, while price bars illustrate the open, high, low, and close of an asset. By comparing the relationship between volume and price, traders can identify significant changes in market sentiment and anticipate potential price movements.
Throughout this guide, we will explore various VSA concepts including volume analysis, spread analysis, absorption, and climactic action. We will also highlight the importance of volume confirmation and the role of VSA in different types of markets, such as trending, ranging, and reversing. By the end, you will have a comprehensive understanding of VSA and be equipped with the knowledge to apply it effectively in your trading strategies.
Volume Spread Analysis (VSA) is a trading methodology that focuses on analyzing the relationship between price, volume, and the spread (range) of a bar or candlestick chart. It helps traders understand the market dynamics and identify potential trading opportunities based on the principles of supply and demand.
VSA is based on the belief that the “smart money” (professional traders, institutions) leaves footprints in the volume and price movement, which can be used to anticipate future market moves. By analyzing the volume and spread during different market phases, VSA traders can gain insights into the behavior of these smart money participants.
The role of VSA in trading is to provide traders with a framework to interpret market activity and make informed trading decisions. By understanding the forces of supply and demand, traders can identify areas of accumulation (buying pressure) or distribution (selling pressure), which can help them anticipate potential market turning points.
VSA also helps traders identify the signs of market manipulation. It can reveal how the smart money is positioning its trades and potentially manipulating the market to their advantage. By recognizing these patterns, traders can avoid falling into traps set by market manipulators and make more informed trading decisions.

Furthermore, VSA can be used in conjunction with other technical analysis tools to confirm or validate trading signals. By combining VSA with other indicators or chart patterns, traders can increase the probability of successful trades and improve their overall trading performance.
In conclusion, VSA plays a crucial role in trading by providing a unique perspective on market dynamics. It helps traders understand the behavior of the smart money participants, identify potential market turning points, and avoid market manipulation. By incorporating VSA into their trading strategies, traders can make more informed decisions and improve their chances of success.
Volume Spread Analysis (VSA) is a trading methodology that analyzes the relationship between volume, price, and spread in order to identify trends, reversals, and market manipulation. It is based on the premise that professional traders accumulate positions through volume surges, which can be observed through changes in spread and price.
The primary objective of VSA is to gain insight into the actions of professional traders and differentiate between their activities and the actions of retail traders. By understanding the behavior of professional traders, individual traders can make more informed decisions and improve their trading strategies.
VSA focuses on the analysis of volume, which is a key indicator of market activity. It examines how volume changes in relation to price, looking for patterns that indicate the strength or weakness of a market trend. Additionally, VSA considers the spread, which represents the difference between the high and low prices of a trading period.
Read Also: Does eToro offer binary options trading?
One of the key principles of VSA is that the “smart money” or professional traders leave footprints in the market through their trading activities. These footprints can be observed by analyzing volume, price, and spread data. By identifying the footprints of professional traders, VSA aims to anticipate their actions and take advantage of potential market reversals or trends.
| Components of VSA | Description |
|---|---|
| Volume | Indicates the level of activity in the market |
| Spread | Represents the difference between the high and low prices of a trading period |
| No Demand / No Supply | Indicates a lack of interest from buyers or sellers, potentially signaling a reversal |
| Upthrust / Supply Test | Occurs when prices briefly rise or fall to test the supply or demand in the market |
| Effort vs Result | Compares the amount of volume to the resulting price movement |
Read Also: Can You Trade Flight Tickets? Learn How to Exchange Airline Tickets
Overall, VSA provides insights into the dynamics of the market by analyzing volume, price, and spread. By understanding the activities of professional traders and their impact on the market, individual traders can make more informed decisions and enhance their trading strategies.
Volume Spread Analysis (VSA) is a trading methodology developed by the legendary trader Richard Wyckoff. It focuses on analyzing the relationship between price, volume, and spread (range between high and low) in order to identify high-probability trading opportunities.
The key principles of VSA include:
VSA can be applied to various trading markets, including stocks, forex, and commodities. It can be used on different timeframes, from intraday trading to long-term investing. By understanding the principles of VSA, traders can gain insights into market dynamics and make more informed trading decisions.
Overall, VSA offers a unique perspective on analyzing market activity by focusing on the relationship between volume, price, and spread. By combining these principles with other technical analysis tools, traders can enhance their trading strategies and improve their chances of success.

VSA stands for Volume Spread Analysis. It is a trading methodology that analyzes the relationship between volume, price, and spread in order to identify trends and reversals in the market.
VSA works by analyzing the interplay between volume, price, and spread. By looking at the relationship between these three factors, traders can gain insight into the market dynamics and identify potential trading opportunities.
The key concepts of VSA include analyzing volume, looking for signs of strength or weakness, identifying tests and confirmations, and understanding the significance of price and spread.
Yes, VSA can be used in any market, including stocks, forex, commodities, and cryptocurrencies. The principles of VSA can be applied to any market that has volume and price data.
Yes, there are several indicators and tools that can assist with VSA analysis, such as the volume histogram, price spreads, and the effort vs. result indicator. These tools can help traders visualize and interpret the VSA signals.
VSA stands for Volume Spread Analysis. It is a trading methodology that focuses on analyzing the relationship between volume, price, and spread (range) in order to gain insight into the market’s supply and demand dynamics.

Understanding the M15 Strategy in Forex Trading In the fast-paced world of forex trading, having a solid strategy is essential for success. One …
Read Article
Is TrendSpider better than TradingView? When it comes to trading platforms, there are several options available to traders. Two popular choices are …
Read Article
What is the ideal stop loss for day trading? Day trading can be an exciting and profitable way to invest in the financial markets. However, it can …
Read Article
TD Ameritrade Mini Options: What You Need to Know If you are an investor looking to trade options with smaller sizes, mini options at TD Ameritrade …
Read Article
What Do Villagers Want to Trade in Minecraft? If you’re a dedicated Minecraft player, you’ve probably encountered villagers at some point. These …
Read Article
Restricted Stock Units vs. Incentive Stock Options: Understanding the Difference Restricted Stock Units (RSUs) and Incentive Stock Options (ISOs) are …
Read Article


