


Understanding the Key Differences Between Equity Ownership and Options
Understanding the Difference Between Equity Ownership and Options Equity ownership and options are two common ways individuals can participate in the …
Read Article
The 20-day Exponential Moving Average (EMA) is a popular technical analysis tool used by traders and investors to identify and capitalize on short-term price trends.
EMA is a type of moving average that places more weight or importance on recent price data compared to traditional simple moving averages (SMA). It is calculated by taking the weighted average of the past 20 days’ closing prices, giving more significance to the most recent prices.
By focusing on recent price changes, the 20-day EMA can provide a better understanding of the current market sentiment and provide timely signals for buying or selling opportunities.
Traders often use the crossover of the 20-day EMA with other moving averages, such as the 50-day EMA or the 200-day EMA, to confirm trends and generate trading signals. When the price crosses above the 20-day EMA, it may indicate a bullish trend, while a crossover below the 20-day EMA may signal a bearish trend.
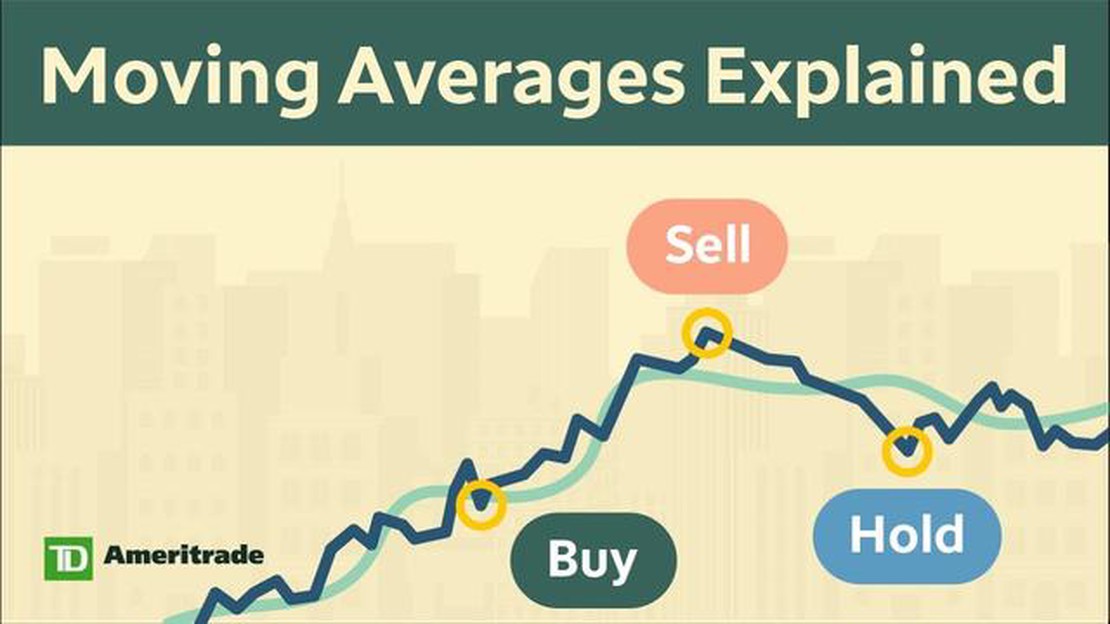
In addition to trend identification, the 20-day EMA can also be used to determine support and resistance levels. In an uptrend, the 20-day EMA often acts as a support level, where the price bounces off and continues its upward movement. Conversely, in a downtrend, the 20-day EMA may act as a resistance level, preventing the price from rising above.
It is important to note that the effectiveness of the 20-day EMA depends on the market being analyzed and the time frame used. Traders should consider using other technical indicators or tools to confirm signals and avoid false alarms.
The 20-day Exponential Moving Average (EMA) is an important technical indicator used by traders and investors to analyze price trends. It is a popular tool because it provides a smoothed line that represents the average price over the past 20 days, which helps to identify the direction of the trend.
One of the main reasons why the 20-day EMA is significant is its ability to respond quickly to price changes. The EMA gives more weight to recent price data, which means it reacts more quickly to price movements compared to other moving averages. This responsiveness allows traders to capture shorter-term price trends and identify potential trading opportunities.
Additionally, the 20-day EMA is widely used in conjunction with other technical indicators to confirm signals. For example, if the price crosses above the 20-day EMA, it could be seen as a bullish signal, indicating that the trend may be shifting towards an upward direction. On the other hand, if the price crosses below the 20-day EMA, it could be a bearish signal, suggesting a potential downtrend.
Furthermore, the 20-day EMA can act as a support or resistance level. Traders often observe how the price reacts when it approaches the 20-day EMA. If the price bounces off the EMA and continues in its previous direction, it can be seen as a confirmation of the trend. Conversely, if the price breaks below the EMA and fails to move back above it, it could indicate a change in the trend.
In conclusion, the 20-day Exponential Moving Average is a valuable tool for traders and investors. Its ability to respond quickly to price changes and its use as a confirmation tool make it a popular choice among technical analysts. By understanding the importance of the 20-day EMA, traders can gain insight into potential trends and make more informed trading decisions.
The 20-day Exponential Moving Average (EMA) is a technical indicator widely used in trading to analyze and predict price movements in financial markets. It is a type of moving average that gives more weight to recent price data, making it more responsive to changes in the market.

The EMA is calculated by taking the average of a specified number of price data points over a designated time period, in this case 20 days. However, unlike the simple moving average (SMA), which gives equal weight to all data points, the EMA assigns greater importance to more recent data points.
This weighting is achieved by using a smoothing factor that places more emphasis on recent price data while gradually diminishing the impact of older data. The formula for calculating the EMA involves multiplying the previous EMA value by a smoothing factor and adding the current price multiplied by a complementary factor.
The 20-day EMA is widely considered a short-term trend indicator, providing more timely and responsive signals compared to longer-term moving averages. Traders often use the 20-day EMA to identify short-term trends and potential entry or exit points in the market.
Read Also: Discover the Various Types of Stock Traders and Their Strategies
When the price is above the 20-day EMA, it suggests a bullish trend, indicating that the price is likely to continue rising. Conversely, when the price is below the 20-day EMA, it indicates a bearish trend, suggesting that the price is likely to continue falling.
By analyzing the relationship between the price and the 20-day EMA, traders can identify potential trading opportunities and make informed decisions based on these signals. It is important to note that the 20-day EMA should not be solely relied upon for trading decisions, but rather used in conjunction with other indicators and analysis techniques to confirm signals.
In conclusion, the 20-day EMA is a popular and effective tool for analyzing short-term price trends in financial markets. It provides traders with valuable insights into market dynamics, helping them make more accurate predictions and improve their trading strategies.
The 20-day EMA, or Exponential Moving Average, is a popular technical indicator used by traders to analyze price trends in financial markets. This moving average focuses on the most recent data points and gives more weight to the latest prices, making it a dynamic and responsive tool for traders.
Read Also: What is the value of $100 US in Switzerland?
One way to use the 20-day EMA in trading is to identify the direction of the trend. When the price is above the 20-day EMA, it indicates an uptrend, while a price below the 20-day EMA suggests a downtrend. Traders can use this information to make trading decisions based on the prevailing trend.
Another way to use the 20-day EMA is to generate buy and sell signals. When the price crosses above the 20-day EMA, it can be considered a buy signal, indicating a potential uptrend. Conversely, when the price crosses below the 20-day EMA, it can be seen as a sell signal, suggesting a possible downtrend.
Traders can also use the 20-day EMA as a support or resistance level. In an uptrend, the 20-day EMA can act as a support level, where the price bounces off and continues its upward movement. In a downtrend, the 20-day EMA can act as a resistance level, where the price struggles to break above and resumes its downward trajectory.

Additionally, traders can combine the 20-day EMA with other technical indicators or chart patterns to enhance their trading strategies. For example, they may use the 20-day EMA in conjunction with the 50-day EMA to confirm trends or look for crossovers that signal potential reversals.
It’s important for traders to remember that the 20-day EMA is just one tool among many in their trading toolbox. It should be used in conjunction with other indicators and analysis techniques to make informed trading decisions. Traders should also consider the specific characteristics of the market they are trading and adapt their strategies accordingly.
In conclusion, the 20-day EMA is a versatile and useful tool for traders. It can help identify trends, generate buy and sell signals, act as support or resistance levels, and complement other technical indicators. By understanding how to use the 20-day EMA effectively, traders can gain valuable insights into price trends and improve their trading performance.
The 20-day EMA gives more weight to recent price data and reacts faster to price changes compared to the simple moving average (SMA).
The 20-day EMA is often used by traders and investors as a short-term trend indicator. It helps in identifying potential buying or selling opportunities based on the direction of the EMA line.
The 20-day EMA is calculated by taking the average of the closing prices over the past 20 trading days, with more weight given to the most recent prices.
The 20-day EMA can be used as a stand-alone indicator, but it is often used in conjunction with other technical indicators to confirm signals and enhance trading strategies.
Some drawbacks of using the 20-day EMA include the potential for false signals during volatile market conditions and the lagging effect it can have on price movements.
The 20-day Exponential Moving Average (EMA) is a technical indicator used by traders to analyze trends in the stock market. It is a moving average that gives more weight to recent price data, making it more responsive to short-term changes in price. It is calculated by averaging the closing prices of a stock over the past 20 trading days, with more weight given to the most recent prices.
The 20-day EMA is calculated by taking the weighted average of the closing prices of a stock over the past 20 trading days. The formula to calculate the 20-day EMA is: EMA = (Closing Price - EMA(previous day)) * (2 / (20 + 1)) + EMA(previous day). This formula gives more weight to the most recent prices, making the EMA more responsive to short-term price changes.

Understanding the Difference Between Equity Ownership and Options Equity ownership and options are two common ways individuals can participate in the …
Read Article
Beginner’s Guide: How to Play Forex Welcome to the exciting world of forex trading! Whether you are a complete beginner or someone with some …
Read Article
Is VWAP a good indicator for forex? When it comes to forex trading, there are countless indicators that traders can use to analyze the market and make …
Read Article
Beginner’s Guide: Essential First Chords to Learn Learning to play the guitar can be a daunting task, especially for beginners. With so many chords …
Read Article
Is it Possible to Make a Profit with Binary Options? Binary options trading has gained popularity in recent years as a way to make quick and easy …
Read Article
Is trading necessary in Path of Exile? Path of Exile is an action role-playing game known for its deep and complex gameplay mechanics. One of the key …
Read Article


