


Understanding the Mechanism behind VWD: How does it Work?
Understanding VWD: A Comprehensive Guide on How It Works Von Willebrand Disease (VWD) is a genetic bleeding disorder that affects the blood’s ability …
Read Article
The 20-day moving average is a commonly used tool in the world of finance and investing. It is a simple yet powerful indicator that helps traders and investors make informed decisions about buying or selling stocks, commodities, or other financial instruments. By analyzing the average price over a specific period of time, this moving average provides valuable insights into market trends and helps identify potential entry or exit points.
One of the key benefits of using a 20-day moving average is its ability to smoothen out short-term price fluctuations and noise in the market. It helps filter out temporary price movements caused by volatility or random factors, allowing traders to focus on the underlying trend. By looking at the average price over the past 20 days, traders can gain a clearer understanding of the overall direction of the market and avoid making impulsive decisions based on short-term price movements.
Additionally, the 20-day moving average is often used to identify support and resistance levels. When the price is above the moving average, it can act as a support level, indicating that the price is more likely to bounce back up. Conversely, when the price is below the moving average, it can act as a resistance level, suggesting that the price is more likely to face selling pressure. This knowledge can be invaluable in determining the optimal time to enter or exit a trade.
Furthermore, the 20-day moving average can be combined with other technical indicators to form a robust trading strategy. For example, traders often use it in conjunction with the 50-day moving average or the 200-day moving average to confirm signals or generate buy/sell signals. These combinations provide a more comprehensive view of the market and enhance the accuracy of the trading signals.
In conclusion, the 20-day moving average is a powerful tool that helps traders and investors analyze market trends, identify support and resistance levels, and generate buy/sell signals. Its ability to smoothen out short-term price fluctuations and its compatibility with other technical indicators make it a popular choice among market participants. By incorporating the 20-day moving average into their trading strategies, traders can gain a competitive edge and improve their chances of success in the financial markets.
In the world of technical analysis, a moving average is a commonly used indicator that helps traders identify trends and potential price reversals. It is a calculation that takes into account a specified number of data points over a specific time frame to give an average value.
Moving averages are used to smooth out price fluctuations and filter out noise in the market. They can be calculated for any time frame, whether it’s hourly, daily, weekly, or monthly. However, the most commonly used moving averages are those calculated over the past 20 days, 50 days, and 200 days.

The 20-day moving average, in particular, is favored by many traders for its ability to capture shorter-term trends and provide timely signals. It is often used in conjunction with longer-term moving averages to confirm overall market direction.
By plotting the 20-day moving average on a price chart, traders can easily visualize the average price over the past 20 days. This helps identify whether the current price is above or below the average and provides a sense of whether the market is in an uptrend or downtrend.
When the price is above the 20-day moving average, it suggests bullishness, indicating that the current price is higher than the recent average. Conversely, when the price is below the 20-day moving average, it suggests bearishness, indicating that the current price is lower than the recent average.
Moving averages can also act as support and resistance levels. As the price approaches the moving average, it may find support and bounce off it, or it may struggle to break through if it is acting as resistance.
Read Also: Best Broker for Scalping Options: Find Your Ideal Partner Today
In summary, moving averages are valuable tools in technical analysis as they help traders identify trends, filter out noise, and provide insights into market direction. The 20-day moving average, in particular, is widely used for its ability to capture shorter-term trends and generate timely signals.
The 20-day moving average is a widely used technical analysis tool in the financial markets. It is considered significant for several reasons.
Firstly, the 20-day moving average provides a smoothed line that helps to identify the overall trend of a security or an index. By calculating the average price over the past 20 trading days, it smooths out short-term price fluctuations and gives a clearer indication of the underlying trend. This can be helpful for traders and investors to make informed decisions based on the direction of the market.
Furthermore, the 20-day moving average is often used as a support or resistance level. In an uptrend, the moving average can act as a support level, where prices tend to bounce off or find buying interest. Conversely, in a downtrend, the moving average can act as a resistance level, where prices often struggle to break above. Traders often pay close attention to these levels as they can indicate potential entry or exit points.
Read Also: When does the dollar go? Discover the factors that influence the fluctuation of the dollar exchange rate.
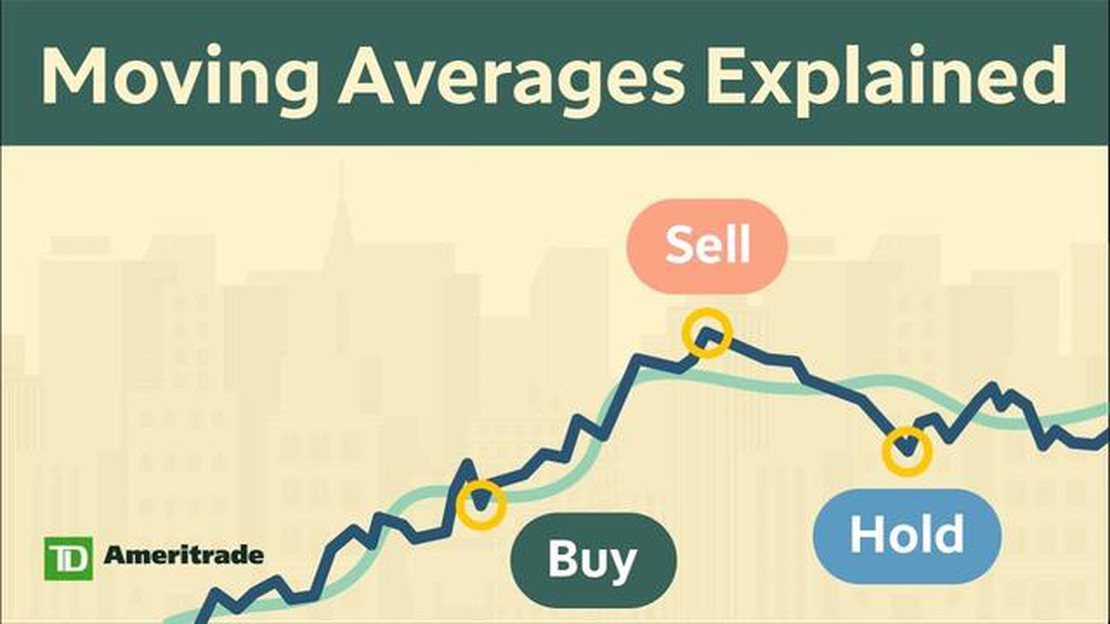
In addition, the 20-day moving average can also be used to generate buy or sell signals. When the price crosses above the moving average, it is considered a bullish signal, suggesting a potential uptrend. On the other hand, when the price crosses below the moving average, it is seen as a bearish signal, indicating a potential downtrend. This crossover strategy is commonly used by traders to confirm or validate the direction of the market.
Overall, the 20-day moving average is a versatile tool that helps traders and investors analyze price trends, identify support and resistance levels, and generate trading signals. By understanding its significance and incorporating it into their analysis, market participants can gain valuable insights and improve their decision-making process.
Using a 20-day moving average has several benefits for traders and investors alike. Here are a few key advantages:
| 1. Smooths Out Short-Term Price Fluctuations | A 20-day moving average helps smooth out the noise from short-term price fluctuations. By averaging the closing prices over the past 20 days, it provides a clearer picture of the overall trend. |
| 2. Identifies Potential Buying and Selling Opportunities | When the current price of an asset crosses above the 20-day moving average, it can signal a potential buying opportunity. Conversely, when the price falls below the moving average, it may indicate a selling opportunity. |
| 3. Confirms the Strength of an Uptrend or Downtrend | A 20-day moving average can validate the strength of an uptrend or downtrend. If the price consistently stays above the moving average during an uptrend, it confirms the upward momentum. Conversely, if the price remains below the moving average during a downtrend, it confirms the downward momentum. |
| 4. Provides Support and Resistance Levels | The 20-day moving average can act as a support level during an uptrend and a resistance level during a downtrend. Traders can use these levels as reference points for determining entry and exit points. |
| 5. Helps Filter Out Market Noise | By focusing on a longer time frame, the 20-day moving average helps filter out market noise and provides a more reliable signal. It reduces the impact of short-term volatility and improves decision-making for traders and investors. |

Overall, the 20-day moving average is a versatile technical indicator that offers valuable insights into price trends and potential trading opportunities. When used correctly, it can assist in making informed decisions and improving overall trading performance.
A 20-day moving average is a technical indicator that calculates the average closing price of a stock over the past 20 trading days. It is used to identify trends and smooth out short-term fluctuations in price.
A 20-day moving average is commonly used because it provides a good balance between being responsive to changes in price and smoothing out noise. It is flexible enough to capture short-term trends while still giving a clear picture of the overall trend.
A 20-day moving average helps in stock analysis by providing a visual representation of the stock’s price trend. It helps traders and investors identify potential buy or sell signals based on the relationship between the stock’s price and the moving average line. It can also help determine support and resistance levels.
Yes, a 20-day moving average can be used for different timeframes. It can be applied to any market or timeframe, such as daily, weekly, or monthly charts. The time period used in the moving average calculation can be adjusted to suit the needs of the trader or investor.
While a 20-day moving average can be a useful tool, it has some limitations. It is a lagging indicator, which means it may not always reflect current market conditions or provide timely signals. Additionally, it can produce false signals during periods of flat or choppy price movements. Traders and investors should use it in conjunction with other indicators and analysis techniques.

Understanding VWD: A Comprehensive Guide on How It Works Von Willebrand Disease (VWD) is a genetic bleeding disorder that affects the blood’s ability …
Read Article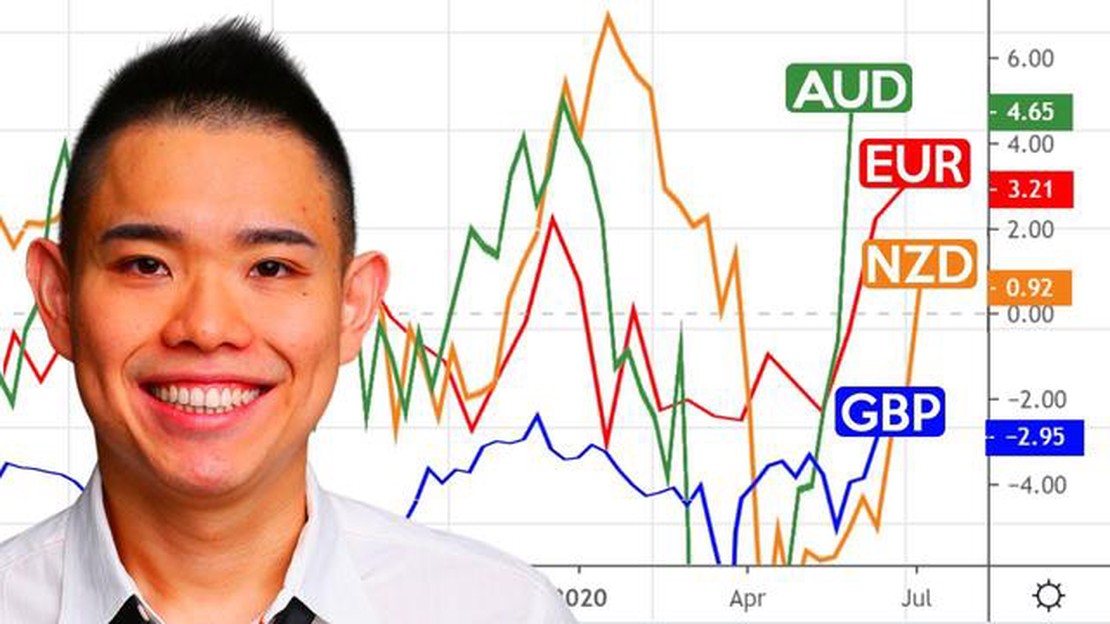
Trading Forex with Currency Strength: A Comprehensive Guide Forex trading, also known as foreign exchange trading, is a decentralized global market …
Read Article
How to Calculate Average Exchange Rate per Year Calculating the average exchange rate per year is a crucial task for many businesses and individuals …
Read Article
Benefits of Brokers Using MT4 Metatrader 4 (MT4) has become one of the most popular trading platforms among brokers for several reasons. Its …
Read Article
Choosing the Best Entry Point in Forex Trading When it comes to forex trading, one of the most crucial elements of success is choosing the right entry …
Read Article
How to Achieve 100 Pips Daily in Forex Trading? Trading in the forex market can be a highly profitable venture, but it requires a certain level of …
Read Article


