


Is the Forex Market a Genuine Investment Opportunity or Scam? Unveiling the Truth
Is the forex market real or fake? The Forex market, also known as the Foreign Exchange market, is a decentralized global market where the world’s …
Read Article
In the world of trading, there are many strategies that traders employ to try and capitalize on the ever-changing market. One such strategy is momentum trading, which involves identifying and following the trend of a particular stock or market. Momentum traders believe that stocks and markets tend to continue in the same direction for a certain period of time, and they aim to profit from these trends.
One of the key indicators that momentum traders use is the Relative Strength Index (RSI). The RSI is a momentum oscillator that measures the speed and change of price movements. It helps traders determine if a stock is overbought or oversold, and it can signal potential reversals in the trend. Traders often look for stocks with an RSI above 70 to indicate overbought conditions, or below 30 to indicate oversold conditions.
Another important indicator for momentum traders is the Moving Average Convergence Divergence (MACD). The MACD is a trend-following momentum indicator that shows the relationship between two moving averages of a stock’s price. It consists of a MACD line and a signal line, and when the MACD line crosses above the signal line, it is considered a bullish signal, indicating that the stock’s upward momentum is increasing. On the other hand, when the MACD line crosses below the signal line, it is considered a bearish signal, indicating that the stock’s downward momentum is increasing.
Lastly, momentum traders often pay attention to volume indicators, such as the On-Balance Volume (OBV) indicator. The OBV indicator measures the cumulative buying and selling pressure of a stock based on its volume. Traders look for stocks with increasing volume during trends, as it confirms the strength of the trend. When the OBV indicator is trending upward, it suggests that buyers are in control and the stock’s upward momentum is likely to continue.
Understanding the key indicators used in momentum trading is crucial for traders looking to take advantage of short-term trends in the market. By analyzing the RSI, MACD, and volume indicators, traders can gain insight into the strength and direction of a stock’s momentum. However, it is important to note that momentum trading carries its own risks, and traders should always conduct thorough research and risk management strategies before making any trading decisions.
Momentum trading is a popular trading strategy that is based on the idea that assets that have been performing well will continue to perform well, while assets that have been performing poorly will continue to perform poorly. Traders who use momentum trading try to take advantage of these trends by buying assets that have been gaining strength and selling assets that have been losing strength.
To identify potential momentum trading opportunities, traders often use technical indicators and charts to track the price and volume movements of different assets. These indicators can help traders identify assets that are experiencing strong upward or downward momentum, indicating potential buying or selling opportunities.
When executing momentum trades, it is important for traders to set appropriate stop-loss orders to manage risk. This helps protect against potential losses if the momentum of an asset suddenly reverses.
Read Also: Understanding the Balikbayan Box Limit: Everything You Need to Know
Momentum trading can be a high-risk, high-reward strategy, as it relies on the assumption that price trends will continue in the short term. Traders who practice momentum trading must closely monitor the market and be prepared to react quickly to changing conditions.
Overall, momentum trading can be a powerful tool for traders to capitalize on short-term market trends. However, it is important for traders to thoroughly research and understand the concept of momentum trading before implementing this strategy.
Momentum trading is a popular strategy among traders looking to take advantage of short-term price movements. It focuses on identifying stocks or assets that are showing strong upward or downward momentum and capitalizing on these trends.
The basic idea behind momentum trading is that trends tend to persist, meaning that stocks that are gaining momentum are likely to continue to do so in the near future. By identifying these stocks, traders can enter positions and ride the trend, potentially making profitable trades.
One key indicator to watch when using momentum trading is the relative strength index (RSI). The RSI is a technical indicator that measures the speed and change of price movements. It is typically used to identify overbought or oversold conditions in an asset, which can indicate a potential reversal in the short-term trend.
Another important indicator to consider is the moving average convergence divergence (MACD). The MACD is a trend-following momentum indicator that shows the relationship between two moving averages of a security’s price. When the MACD line crosses above the signal line, it is considered a bullish signal, indicating that the stock may be showing upward momentum.
Read Also: Discover the Power of the Super Trend Non-Repaint Indicator
It’s important to note that momentum trading is a short-term strategy and requires active monitoring of the market. Traders need to be able to identify and react quickly to changes in momentum, as trends can change rapidly. Additionally, proper risk management techniques should be used to protect against potential losses.
Overall, momentum trading can be a profitable strategy when used correctly. By understanding the basics and keeping a close eye on key indicators, traders can increase their chances of success in the market.
Momentum trading is a strategy that involves buying or selling assets based on the recent price trends. Traders believe that assets that have been performing well in the recent past will continue to do so in the future.

Some key indicators used in momentum trading include moving averages, relative strength index (RSI), and stochastic oscillator. Moving averages help identify the general trend of an asset, while RSI and stochastic oscillator help determine whether an asset is overbought or oversold.
Timing in momentum trading is crucial. Traders often look for confirmation of a trend before entering a trade. They may use a combination of technical indicators, such as moving average crossovers or breakouts from resistance levels, to identify potential entry and exit points.
Momentum trading can be applied to a wide range of assets, including stocks, currencies, commodities, and even cryptocurrencies. However, it is important to note that not all assets exhibit strong momentum trends, so it’s crucial to analyze each asset individually before applying a momentum trading strategy.

Is the forex market real or fake? The Forex market, also known as the Foreign Exchange market, is a decentralized global market where the world’s …
Read Article
Types of Options Traded on NSE Options trading is a popular method of investing in the stock market. It provides traders with the opportunity to …
Read Article
Does Nadex payout? When it comes to trading on Nadex, understanding the payout structure is essential. Nadex is a leading binary options exchange that …
Read Article
Trading Options with Penny Stocks: What You Need to Know If you’re a trader or investor looking to capitalize on the volatility of penny stocks, you …
Read Article
Can I use MT4 on Mac? MetaTrader 4 (MT4) is one of the most popular trading platforms used by forex traders around the world. However, MT4 was …
Read Article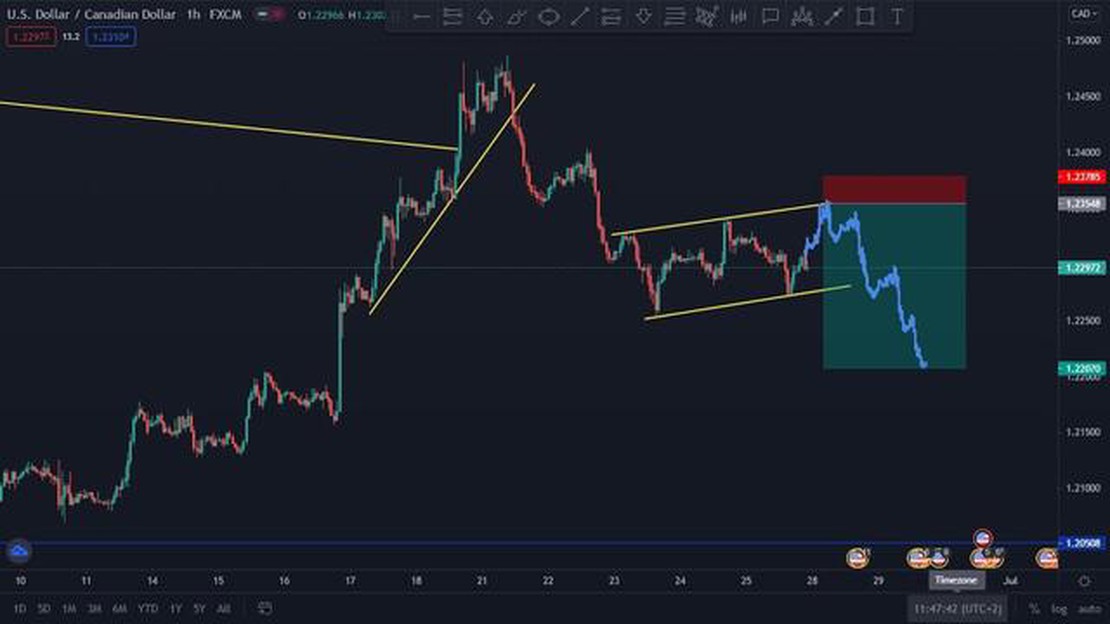
How to Create a Forex Signal: A Step-by-Step Guide Forex trading is a popular investment option that allows traders to earn profits by speculating on …
Read Article


