

Understanding Bollinger Bands: An In-depth Explanation
Understanding Bollinger Bands: Explained and Simplified Bollinger Bands are a popular technical analysis tool used by traders to analyze financial …
Read Article
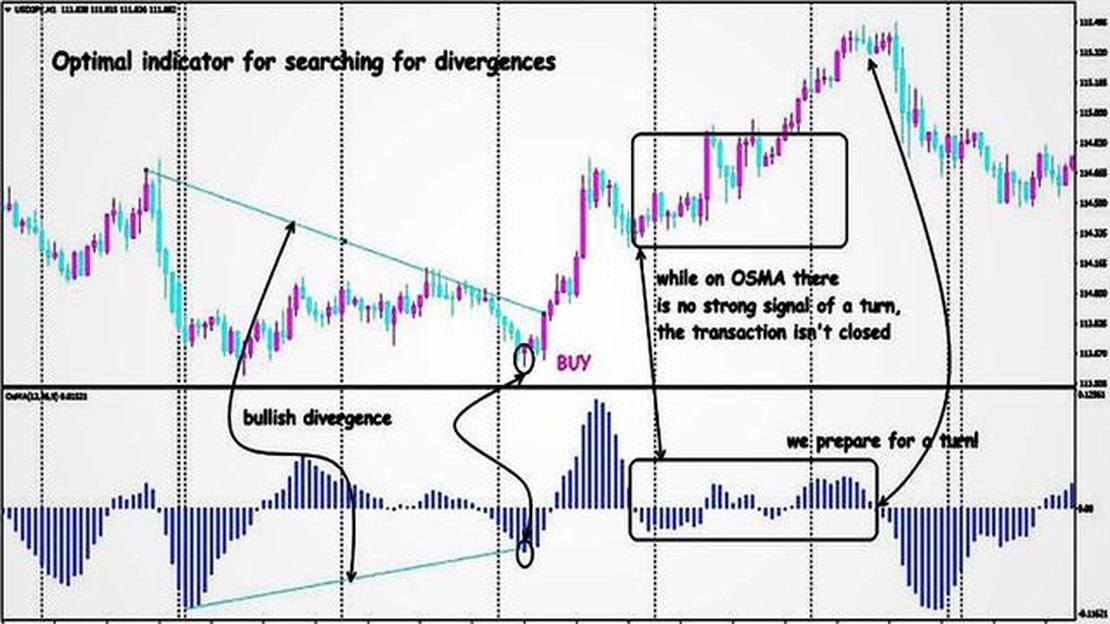
A moving average oscillator is a powerful tool used by traders and analysts to better understand market trends and make informed decisions. By calculating the difference between a short-term moving average and a long-term moving average, the oscillator provides valuable insights into the strength and direction of a market’s momentum.
The oscillator is commonly used in technical analysis to identify overbought and oversold conditions in a market. When the oscillator reaches extreme levels, it suggests that the market may be due for a reversal or correction. Traders can use this information to time their trades accordingly and maximize profits.
One of the key advantages of using a moving average oscillator is its ability to smooth out price fluctuations and provide a clearer picture of the underlying trend. By filtering out short-term noise, the oscillator helps traders identify the overall market direction and avoid false signals.
In this comprehensive guide, we will delve into the intricacies of the moving average oscillator, exploring its various components, calculations, and interpretation. Whether you’re a beginner or an experienced trader, this guide will provide you with the knowledge and tools to harness the power of the oscillator and improve your trading strategies.
An oscillator is a technical indicator used in financial markets to analyze the price movements of assets such as stocks, currencies, or commodities. It is a popular tool among traders and analysts because it can provide valuable insights into the strength and direction of a trend.
An oscillator is derived from a mathematical formula that calculates the relationship between an asset’s current price and its historical price. The resulting value is plotted on a chart, usually as a line or histogram, and fluctuates between predefined upper and lower limits.

Oscillators are commonly used to identify overbought and oversold conditions in an asset. When an oscillator reaches the upper limit, it suggests that the asset is overbought, meaning its price may have risen too far too fast and is due for a correction. Conversely, when an oscillator reaches the lower limit, it indicates that the asset is oversold, suggesting that its price may have decreased too much and could soon rebound.
In addition to identifying overbought and oversold conditions, oscillators can also be used to generate buy and sell signals. Traders look for specific patterns or crossovers on the oscillator chart that indicate a potential trend reversal or continuation. For example, a bullish divergence occurs when an asset’s price makes a lower low while the oscillator makes a higher low, suggesting that the downtrend may be losing momentum and a reversal could be imminent.
Read Also: Mastering the EMA Ribbon: A Complete Guide to Trading Strategies
It’s important to keep in mind that oscillators are not infallible and should be used in conjunction with other technical indicators and analysis methods. They are just one tool in a trader’s toolbox and should be combined with other indicators and factors to make more informed trading decisions.
Common examples of oscillators include the Relative Strength Index (RSI), Moving Average Convergence Divergence (MACD), Stochastic Oscillator, and the Momentum Indicator.
When it comes to technical analysis, one concept that is often mentioned is the oscillator. An oscillator is a technical indicator that is used to analyze the price movements of an asset or security. It is based on the premise that prices tend to move in a predictable manner and that certain patterns or trends can be identified.
An oscillator works by comparing the current price of an asset to its historical prices over a given period of time. It then calculates a value or index that ranges between certain minimum and maximum levels. This value is plotted on a chart, usually below the main price chart, and is used to identify overbought or oversold conditions in the market.
One of the key advantages of using an oscillator is that it helps traders identify potential reversal points in the market. For example, if an oscillator indicates that an asset is overbought, it suggests that the price may soon start to decline. Conversely, if an oscillator indicates that an asset is oversold, it suggests that the price may soon start to rise.
Another advantage of using an oscillator is that it can help traders confirm the strength of a trend. By comparing the movement of an oscillator to the movement of the price, traders can determine whether a trend is likely to continue or if it may be losing momentum. This can be particularly useful when trying to identify trend reversals or trend continuation patterns.
Read Also: Top Strategies for Effective Risk Management in Forex Trading
There are many different types of oscillators that traders can use, each with its own unique formula and set of parameters. Some of the most popular oscillators include the Relative Strength Index (RSI), the Moving Average Convergence Divergence (MACD), and the Stochastic Oscillator. Traders can choose the oscillator that best fits their trading style and preferences.
In conclusion, oscillators play an important role in technical analysis as they help traders identify potential reversal points and confirm the strength of a trend. By understanding how an oscillator works and how to interpret its signals, traders can improve their ability to make informed trading decisions.

An oscillator is a technical indicator that fluctuates above and below a centerline, indicating overbought or oversold conditions in the market.
The oscillator of a moving average is calculated by taking the difference between two moving averages and plotting it as a line that fluctuates above and below a centerline.
The oscillator of a moving average is used to identify potential trend reversals or overbought/oversold conditions in the market.
When the oscillator is above the centerline, it indicates a bullish trend or overbought conditions. When it is below the centerline, it indicates a bearish trend or oversold conditions.
Yes, the oscillator of a moving average can generate false signals and may not work well in trending markets. It is important to use it in conjunction with other indicators and confirm signals with additional analysis.

Understanding Bollinger Bands: Explained and Simplified Bollinger Bands are a popular technical analysis tool used by traders to analyze financial …
Read Article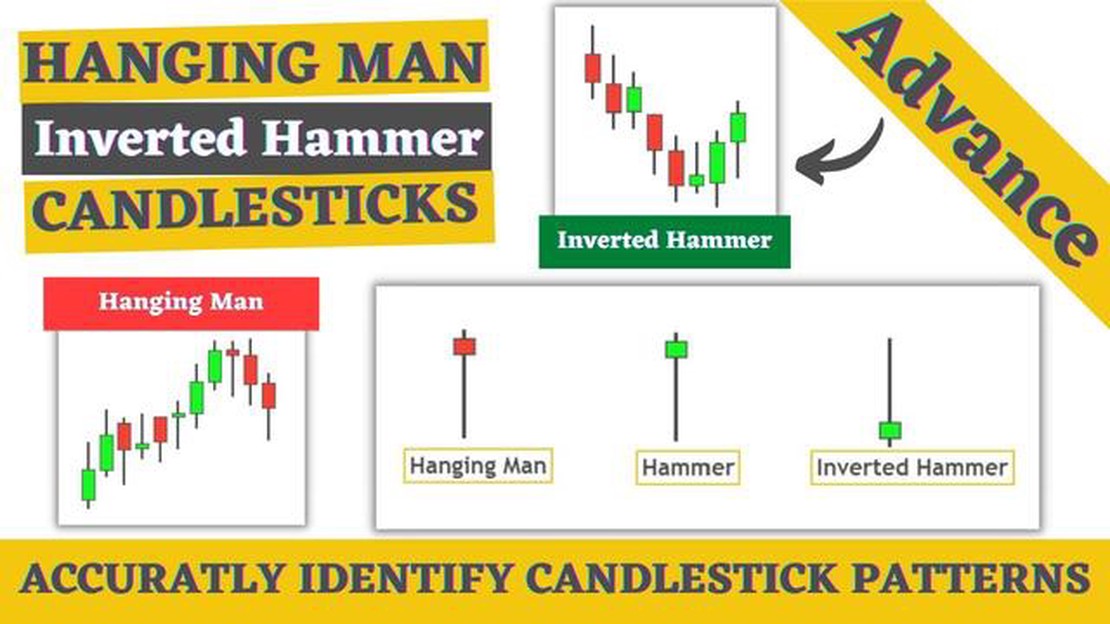
Understanding the Concepts of Hammer and Hanging Man Candlestick Patterns The hammer and hanging man are two commonly seen candlestick patterns in …
Read Article
Understanding the 4H: A Key Concept in Forex Trading When it comes to Forex trading, understanding the 4H chart is crucial. The 4H chart, also known …
Read Article
What is the platform for swaps? Swapping is becoming an increasingly popular way to trade assets in the digital world. With the rise of decentralized …
Read Article
TMGM vs IC Markets: Which Broker is Better? When it comes to forex trading, choosing the right broker is essential for success. Two popular options in …
Read Article
Why psychology plays a crucial role in Forex trading Forex trading, the foreign exchange market, can be a highly profitable and exciting endeavor. …
Read Article


