


Understanding Position Management in Trading: Strategies and Techniques
Understanding Position Management in Trading Position management plays a crucial role in successful trading. It involves the careful monitoring and …
Read Article
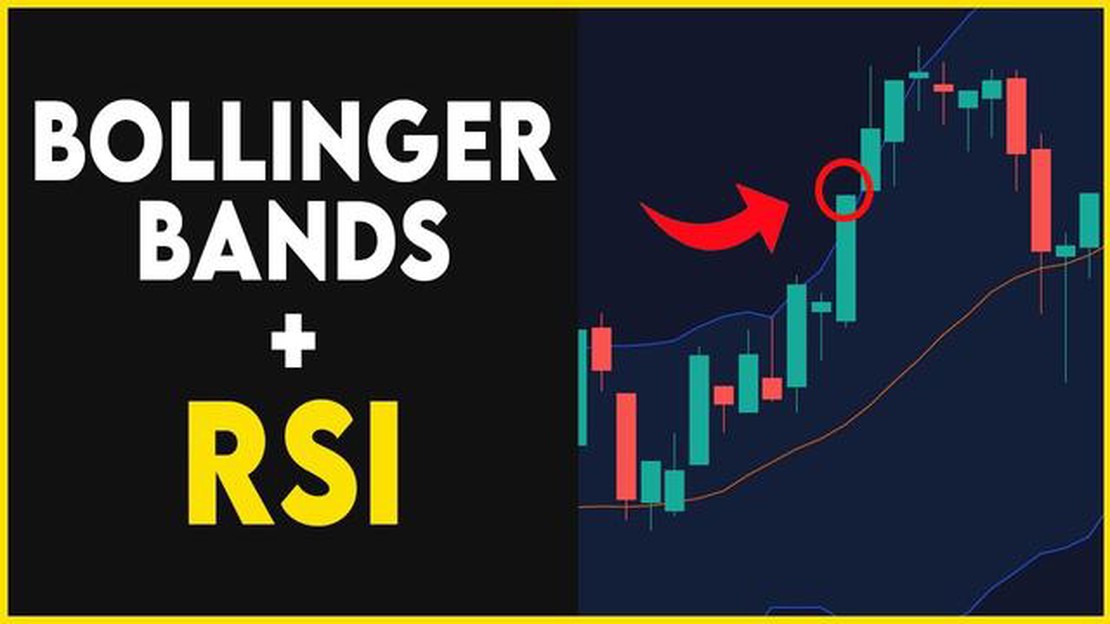
Bollinger Bands are a popular technical analysis tool used by traders to analyze financial markets. Developed by John Bollinger, this indicator consists of a simple moving average (usually 20 periods) and two standard deviation lines, known as the upper and lower bands. The bands expand and contract based on market volatility, providing valuable insights into price levels and potential trend reversals.
The upper Bollinger Band represents a level of resistance, while the lower band acts as a support level. When a price reaches the upper band, it is considered overbought, indicating a potential reversal or bearish movement. Conversely, when the price touches the lower band, it is considered oversold, implying a potential reversal or bullish movement. Traders commonly use Bollinger Bands to identify entry and exit points, as well as to determine the strength and duration of a trend.
Additionally, Bollinger Bands provide traders with other useful signals. When the price moves close to the outer bands, it indicates high market volatility, while a narrow distance between the bands indicates low volatility. In addition, the squeeze pattern occurs when the bands narrow significantly, suggesting an imminent breakout. Traders often combine Bollinger Bands with other technical indicators, such as the Relative Strength Index (RSI) or Moving Average Convergence Divergence (MACD), to confirm market signals and improve trading decisions.
It is important to note that Bollinger Bands should not be used as a standalone indicator, but rather as part of a comprehensive trading strategy. While they can provide valuable insights into market conditions and potential price reversals, they are not foolproof and should be used in conjunction with other technical analysis tools and risk management techniques. Understanding Bollinger Bands requires careful analysis and interpretation of market data, making it an invaluable tool for experienced traders.
Bollinger Bands are a technical analysis tool created by John Bollinger. They consist of a center line and two outer bands that form a dynamic channel around a price chart. The center line is a simple moving average, while the outer bands are based on the standard deviation of the price.
The purpose of Bollinger Bands is to provide a relative definition of high and low price levels. They are used to identify overbought and oversold conditions in a market and to visualize volatility.
When the price is close to the upper band, it indicates that the market is overbought, and a reversal or correction may occur. Conversely, when the price is near the lower band, it suggests that the market is oversold and a potential buying opportunity may arise.
Volatility, as indicated by the width of the bands, plays a crucial role in Bollinger Bands. In periods of low volatility, the bands narrow, suggesting that price movements are relatively stable. Conversely, during times of high volatility, the bands widen, indicating increased price fluctuation.
Bollinger Bands can be used in various ways, including trend identification, confirmation of price breakouts, and generating trading signals. Traders often use them in conjunction with other technical indicators to enhance the accuracy of their analysis.
Overall, Bollinger Bands provide traders with a visual representation of price volatility and potential reversal points in the market, making them a valuable tool for technical analysis.

Bollinger Bands are a technical analysis tool that consists of a simple moving average (SMA) and two standard deviation channels, known as the upper Bollinger Band and the lower Bollinger Band. These bands are plotted on top of a price chart, creating a visual representation of price volatility.
Read Also: Understanding the AMT for Stock Options Exercise: Everything You Need to Know
The SMA serves as the centerline of the Bollinger Bands and is calculated based on a specified number of periods, typically 20. The upper band is plotted two standard deviations above the SMA, while the lower band is plotted two standard deviations below the SMA. The standard deviation is a measure of volatility, and the use of two standard deviations provides a 95% confidence interval for the price.
When prices are in the middle of the Bollinger Bands, it indicates that the market is relatively quiet with low volatility. As prices move closer to the outer bands, it suggests increased volatility and potential trading opportunities. If prices touch or exceed the upper band, it may signal an overbought condition, while prices touching or falling below the lower band may indicate an oversold condition.
In addition to identifying potential buying or selling signals, Bollinger Bands can also be used to gauge the strength of a trend. If the bands are widening, it suggests that the trend is strong, while narrowing bands indicate a weakening trend.
Traders often use Bollinger Bands in conjunction with other technical indicators and chart patterns to make more informed trading decisions. By understanding how Bollinger Bands work and interpreting the information they provide, traders can gain insights into price volatility and potentially identify profitable trading opportunities.
Bollinger Bands are a popular technical analysis tool used to identify potential price reversals and trend continuations. They consist of three lines: the middle band, an upper band, and a lower band. The middle band is a simple moving average (SMA) of the underlying asset’s price, while the upper and lower bands are plotted at a certain standard deviation away from the middle band.
When interpreting Bollinger Bands, traders often look for the following conditions:
1. Squeeze: A squeeze occurs when the width of the Bollinger Bands narrows significantly. This indicates low volatility and often precedes a period of increased price volatility. Traders may interpret a squeeze as a potential signal for a breakout or a strong price move.
2. Breakout: When prices break above the upper band or below the lower band, it is considered a breakout. A breakout above the upper band suggests a bullish signal, while a breakout below the lower band suggests a bearish signal. Traders may consider entering long positions when a bullish breakout occurs and short positions when a bearish breakout occurs.
Read Also: Discover the Astounding Daily Revenue generated on Forex
3. Reversals: Bollinger Bands can also be used to identify potential price reversals. When prices reach or exceed the upper band, it may suggest that the asset is overbought and due for a downward correction. Conversely, when prices reach or fall below the lower band, it may suggest that the asset is oversold and due for an upward correction. Traders can use these signals as potential entry or exit points.

4. Trend Continuations: Bollinger Bands can help traders identify trend continuations by observing the price’s relationship with the middle band. In an uptrend, the price tends to stay above the middle band, indicating a strong bullish trend. In a downtrend, the price tends to stay below the middle band, indicating a strong bearish trend. Traders may use this information to confirm the strength of a trend and potentially enter or exit positions.
It is important to note that Bollinger Bands are not absolute indicators and should be used in conjunction with other technical analysis tools and strategies. Additionally, traders should consider other factors such as market conditions, fundamentals, and risk tolerance before making trading decisions.
Bollinger Bands are a technical analysis tool that consist of a moving average and two standard deviation lines, which are positioned above and below the moving average. They are used to measure volatility and identify potential price reversals.
Bollinger Bands work by calculating the standard deviation of price fluctuations over a given period of time. The standard deviation is then multiplied by a factor (usually 2) and added/subtracted to the moving average. The resulting upper and lower bands provide a visual representation of where the price is likely to stay within, and when it might break out.
Yes, Bollinger Bands can be used to identify trends. When the price is trending strongly, the bands will widen, indicating high volatility. When the price is in a consolidation phase, the bands will narrow, indicating low volatility. Traders can use these patterns to determine the strength and direction of a trend.
Yes, Bollinger Bands are widely used by traders for various purposes. They can be used to identify overbought/oversold conditions, to spot potential trend reversals, and to set profit targets and stop losses. However, it’s important to note that Bollinger Bands should not be used in isolation and should be used in conjunction with other technical analysis tools and indicators.
There are several indicators that can be used in conjunction with Bollinger Bands to enhance trading strategies. Some common examples include the Relative Strength Index (RSI), Moving Average Convergence Divergence (MACD), and Stochastic Oscillator. These indicators can provide additional confirmation signals when used together with Bollinger Bands.
Bollinger Bands are a technical indicator that is used to measure volatility in the financial markets.
Bollinger Bands are calculated using a simple moving average and standard deviation. The middle band is the average, and the upper and lower bands are based on a multiplier of the standard deviation.

Understanding Position Management in Trading Position management plays a crucial role in successful trading. It involves the careful monitoring and …
Read Article
Best Forex Demo Account Options to Consider Are you interested in trading the foreign exchange market, but don’t want to risk your hard-earned money? …
Read Article
Discovering Soft FX: A Beginner’s Guide to Understanding and Using Soft FX in Filmmaking Soft FX trading refers to the practice of using software …
Read Article
Step-by-Step Guide: How to do Option Trading in ICICIdirect Option trading is a popular investment strategy that allows traders to speculate on the …
Read Article
Are losses on options tax deductible? Options trading can be a risky endeavor, and while it offers the potential for significant gains, it also …
Read Article
Best Investments in GTA 5 Online: What to Spend Your Money On What are the top investments in GTA 5 Online? Get the best return on your virtual money! …
Read Article


