


What Is Hub's Price Target and How It Affects Investors?
What is Hubs Price Target? When it comes to investing in stocks, one of the key factors that investors consider is the price target. The price target …
Read Article
In the world of financial analysis, the moving average is a popular tool used to understand and interpret trends in price movements. Whether in stocks, commodities, or currencies, analysts rely on moving averages to gain insights into the market’s direction and make informed decisions.
So, what exactly is a moving average? In simple terms, it is the average price of a security over a specific period of time, which “moves” as new data is added. By smoothing out the fluctuations in price, a moving average allows analysts to identify the underlying trend and filter out noise in the data.
There are different types of moving averages, with the most commonly used being the simple moving average (SMA) and the exponential moving average (EMA). The SMA assigns equal weight to each data point, while the EMA assigns more weight to recent data, making it more responsive to price changes.
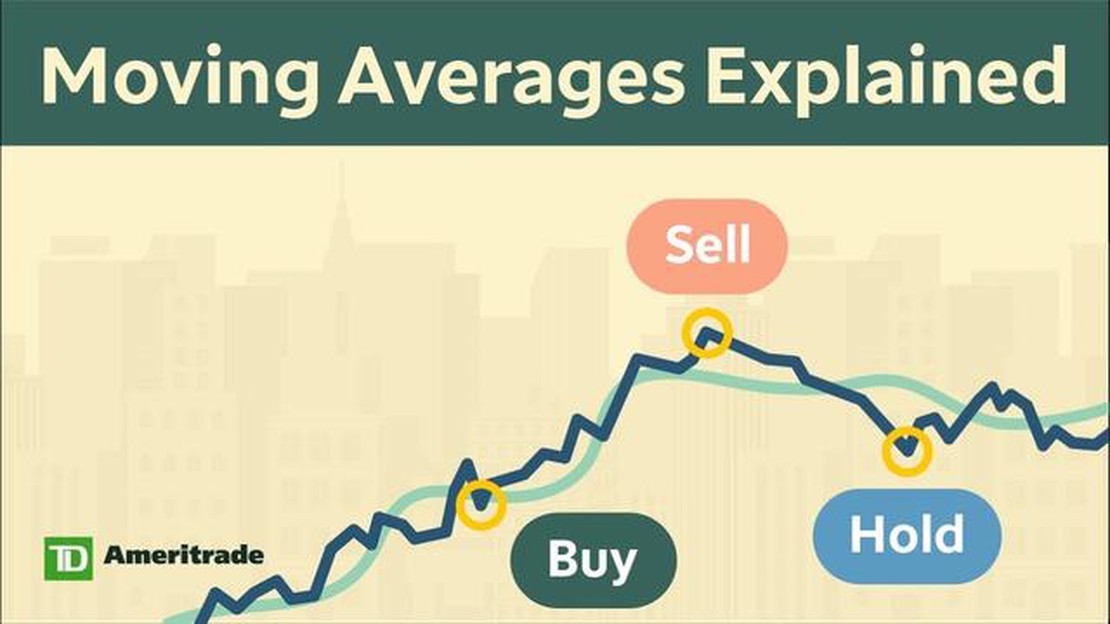
Why is the moving average so essential in financial analysis? Firstly, it helps analysts identify support and resistance levels. When the price of a security is above its moving average, it indicates a bullish trend, while a price below the moving average suggests a bearish trend. Traders often use these levels to set entry and exit points for their trades.
The moving average also helps analysts detect potential trend reversals. When the price crosses above or below the moving average, it can signal a change in market sentiment and a possible reversal in the trend.
Furthermore, the moving average can be used to build trading strategies. Analysts may combine multiple moving averages of different time frames to generate buy or sell signals. For example, a popular strategy is to look for a crossover between a shorter-term moving average and a longer-term moving average to generate a buy or sell signal.
In conclusion, the moving average is a powerful tool in financial analysis that provides valuable insights into market trends, support and resistance levels, trend reversals, and trading strategies. By understanding its purpose and how to interpret it, analysts can make more informed decisions and potentially improve their trading performance.
Moving average is a widely used technical analysis tool in finance that helps traders and investors identify trends and make informed decisions. It is a calculation that provides a smoothed line by generating an average of a set of data points over a specified period of time. By eliminating short-term fluctuations in price, a moving average highlights the overall trend of the data.
There are several types of moving averages, including simple moving average (SMA), exponential moving average (EMA), and weighted moving average (WMA). SMA is the most basic form of moving average, calculated by summing up all the data points over a specified period and dividing it by the number of periods. EMA gives more weight to recent data points, making it more responsive to changes in the trend. WMA assigns different weights to each data point, giving more importance to recent ones.

Moving averages can be calculated for different time frames, such as daily, weekly, or monthly. Traders and investors often use shorter-term moving averages to identify short-term trends, while longer-term moving averages are used to identify long-term trends. The choice of period depends on the trader’s strategy and the timeframe they are analyzing.
One of the main uses of moving averages is to determine support and resistance levels. When the price of an asset crosses above its moving average, it can indicate a bullish signal, while crossing below the moving average can indicate a bearish signal. Moving averages can also help in identifying potential entry and exit points for trades.
Moving averages can be plotted on price charts to visualize the trend. Traders often use multiple moving averages with different time periods to confirm the trend and filter out noise. For example, when a shorter-term moving average crosses above a longer-term moving average, it can signal a strong upward trend.
Read Also: Examples of Predictive Analytics: A Comprehensive Guide
Overall, moving averages play a crucial role in financial analysis as they help traders and investors understand the trend and make educated decisions. While they are not foolproof indicators, they provide valuable insights into the overall direction of the market.
The moving average is a widely used tool in financial analysis as it helps smooth out price data over a specified period of time. It is a simple yet powerful indicator that can provide valuable insights into the trends and patterns of financial markets.
One of the main reasons why moving average is important in financial analysis is its ability to filter out the noise and volatility of price movements. By calculating the average price over a specific time period, the moving average helps to eliminate short-term fluctuations and reveal the underlying trend of the market. This makes it easier for analysts and traders to identify and interpret the long-term direction of an asset or security.
In addition to reducing noise, the moving average also acts as a support or resistance level for the price. When the price is above the moving average, it indicates a bullish trend and suggests that the market sentiment is positive. Conversely, when the price is below the moving average, it indicates a bearish trend and suggests that the market sentiment is negative. Traders often use the moving average as a tool for making buy or sell decisions, as it can provide signals for potential trend reversals.
Furthermore, moving averages can be used to generate trading signals and identify patterns such as crossovers and divergences. A crossover occurs when a shorter-term moving average crosses above or below a longer-term moving average, indicating a potential change in trend. On the other hand, a divergence occurs when the price and the moving average move in opposite directions, suggesting a potential shift in market momentum.
Overall, the moving average is an essential tool in financial analysis that helps to simplify complex price data and reveal the underlying trends and patterns in the market. It provides valuable insights into market sentiment, support and resistance levels, and potential trading opportunities. By incorporating moving averages into their analysis, investors and traders can make more informed decisions and improve their overall profitability.
The moving average is a common indicator used in financial analysis to smooth out price data and identify trends. There are several different types of moving averages that can be used depending on the specific analysis being conducted.
Read Also: Understanding Connors RSI Pullback Strategy: A Powerful Trading Approach2. Exponential Moving Average (EMA): The EMA is similar to the SMA, but it places more weight on recent data points. This is achieved by calculating the EMA using a smoothing factor that exponentially decreases the weight of older data points. The EMA is more responsive to recent price changes compared to the SMA. 3. Weighted Moving Average (WMA): The WMA assigns different weights to each data point, with the most recent data points given the highest weights. The WMA is calculated by multiplying each data point by its assigned weight and then taking the sum over a specified period of time. 4. Hull Moving Average (HMA): The HMA is a more advanced type of moving average that aims to reduce lag and noise in the price data. It uses weighted moving averages to create a smoother line that reacts more quickly to price changes.
 5. Adaptive Moving Average (AMA): The AMA is another advanced type of moving average that adjusts its sensitivity to price changes based on market conditions. It uses a volatility-based multiplier to determine the weight assigned to each data point, allowing it to adapt to different market environments.
Each type of moving average has its own strengths and weaknesses, and the choice of which one to use depends on the specific analysis being performed and the trader’s preferred trading style.
Moving average is used in financial analysis to smooth out price data and identify trends over a period of time. It helps to reduce the impact of short-term fluctuations and noise in the data, making it easier to identify long-term trends.
Moving average is calculated by taking the average of a set of data points over a specific period of time. The period can be as short as a few days or as long as several years, depending on the analysis being performed. Each day, the oldest data point is dropped from the calculation and the most recent data point is added.
The main difference between simple moving average (SMA) and exponential moving average (EMA) is the weighting factor given to each data point. SMA uses equal weights for all data points, while EMA gives more weight to recent data points. This makes EMA more responsive to recent price changes, but also more prone to sudden reversals.
When a shorter-term moving average crosses above a longer-term moving average, it is often seen as a bullish signal and indicates a potential trend reversal from bearish to bullish. On the other hand, when a shorter-term moving average crosses below a longer-term moving average, it is seen as a bearish signal and indicates a potential trend reversal from bullish to bearish.
Moving averages can be used as a part of a larger technical analysis strategy to predict future price movements, but they should not be relied upon solely for making investment decisions. They are best used in combination with other indicators and tools to get a more comprehensive view of the market.

What is Hubs Price Target? When it comes to investing in stocks, one of the key factors that investors consider is the price target. The price target …
Read Article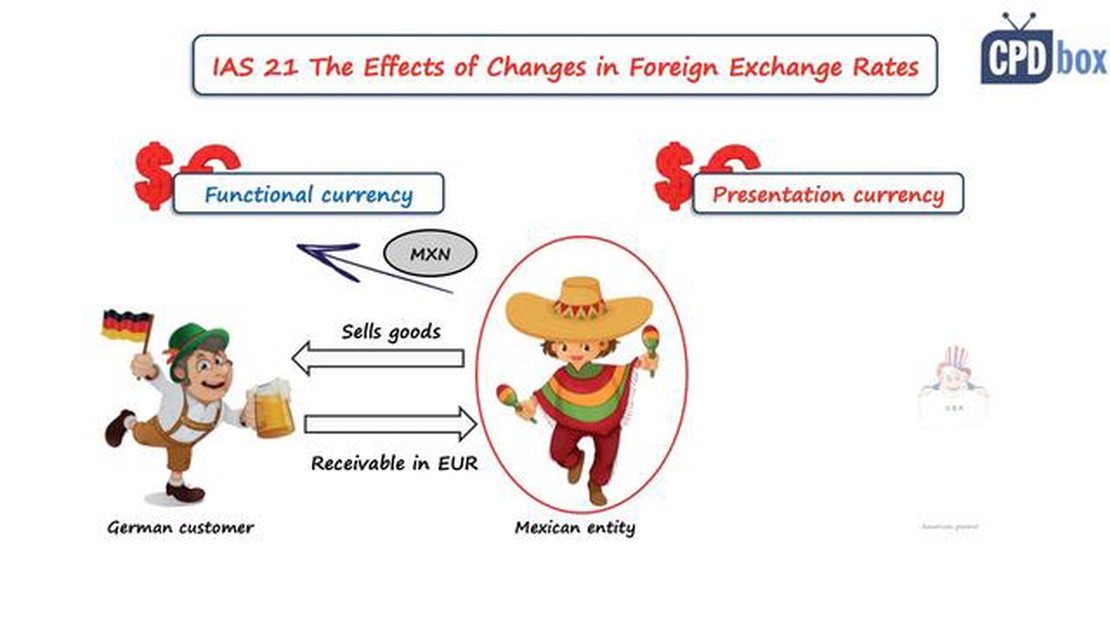
Is IAS 21 still applicable? The International Accounting Standard 21 (IAS 21) was developed by the International Accounting Standards Board (IASB) to …
Read Article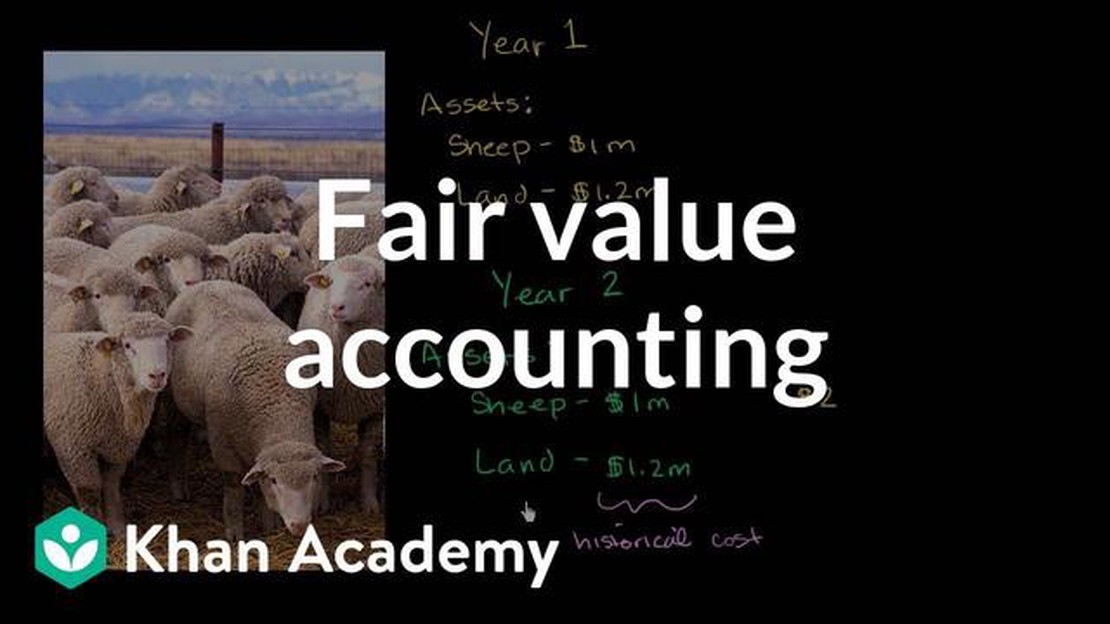
Understanding Fair Value: An Example and Explanation When it comes to assessing the worth of an asset or liability, fair value is a key concept in …
Read Article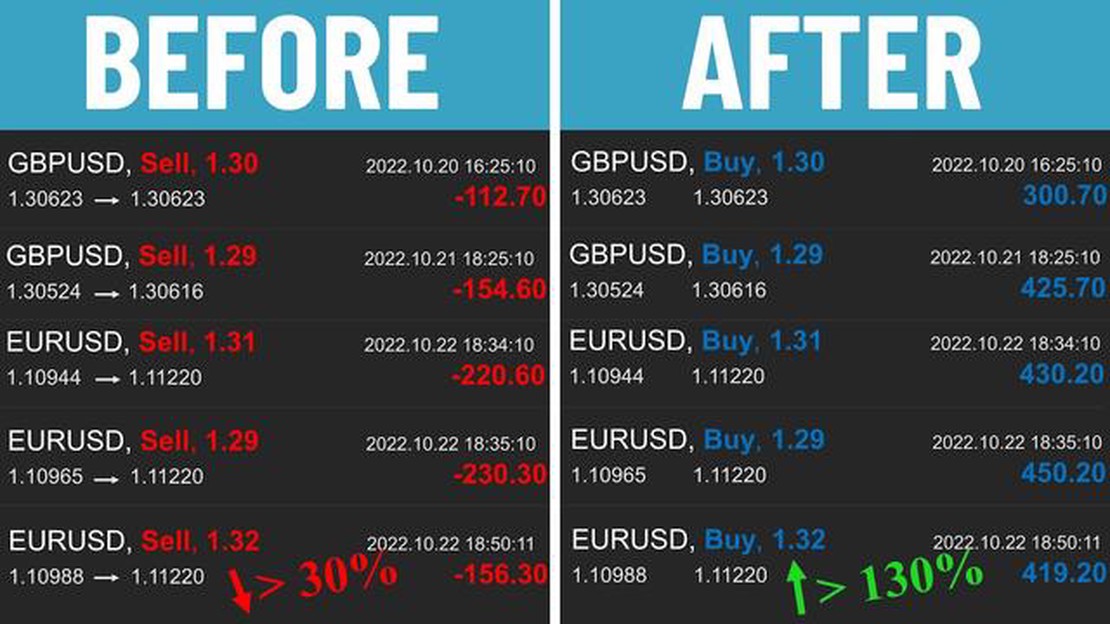
Best Currency Pairs to Trade During New York Session The New York session is one of the most active and volatile trading sessions in the forex market. …
Read Article
Best Places to Exchange Euros into Australian Dollars When traveling to Australia from Europe, one of the first things you will need to consider is …
Read Article
Understanding the Difference between RFS and RFQ When it comes to procurement processes, two of the most commonly used methods are Request for …
Read Article


