

Is Trading Allowed in Saudi Arabia? | A Complete Guide
Trade in Saudi Arabia: all you need to know Trading is a vital part of the global economy, and many countries have specific regulations and …
Read Article
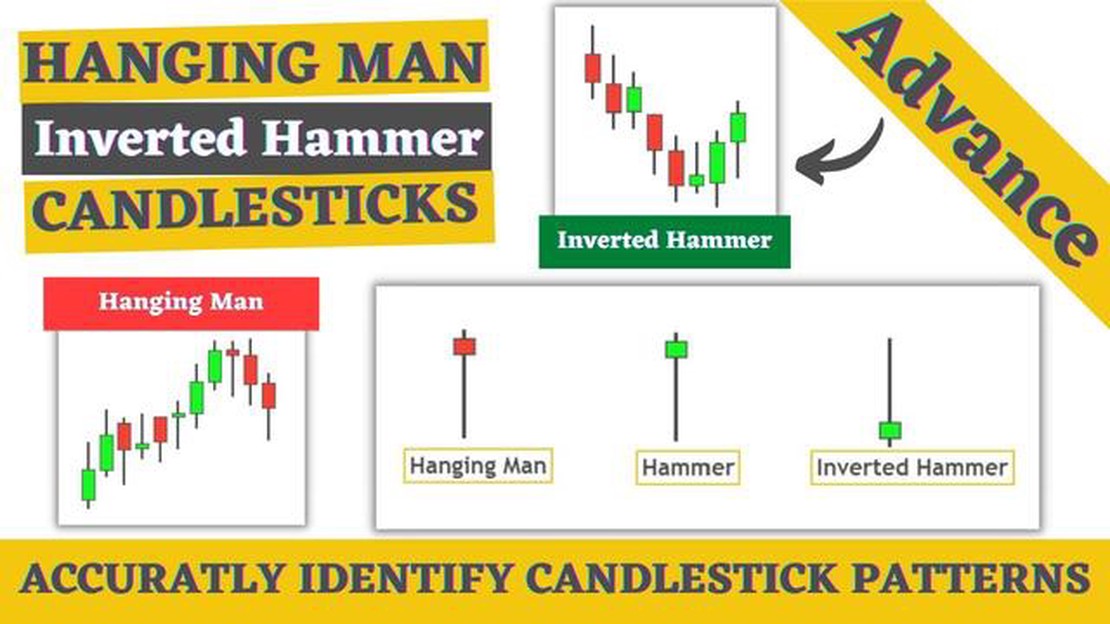
The hammer and hanging man are two commonly seen candlestick patterns in technical analysis. They both have a similar shape, with a small body and a long lower shadow or wick. However, these patterns have different implications for traders.
The hammer is typically seen at the bottom of a downtrend and signals a potential reversal in the market. It forms when the price initially drops during the trading session but then recovers and closes near the opening price. This pattern indicates that buyers have stepped in and are pushing the price back up, suggesting that a bullish trend may be imminent.
In contrast, the hanging man pattern is usually observed at the top of an uptrend and signifies a possible trend reversal. It forms when the price opens near the high of the session, declines significantly during the day, and closes near the opening price. This pattern indicates that sellers have entered the market and are pushing the price down, suggesting that a bearish trend may be on the horizon.
Understanding the difference between these two candlestick patterns is essential for traders as it can help them effectively identify potential buying or selling opportunities and make informed trading decisions. By recognizing the hammer or hanging man patterns, traders can anticipate market reversals and adjust their strategies accordingly.
It is important to note that while these candlestick patterns can provide valuable insights into market sentiment, they should not be relied upon alone. Traders should always use multiple indicators and analyze other aspects of market behavior before making any trading decisions.
Overall, the hammer and hanging man candlestick patterns are powerful tools in technical analysis. By studying these patterns and understanding their significance, traders can gain an edge in the market and improve their chances of success.
Candlestick patterns are an important tool in technical analysis. They provide traders with valuable insights into market sentiment and potential price reversals. Understanding how to identify and interpret candlestick patterns can greatly improve your trading skills.

Each candlestick represents a specific period of time, such as one day or one hour, and consists of a body and two wicks. The body represents the opening and closing prices, while the wicks represent the high and low prices during that time period.
Candlestick patterns can be categorized into bullish and bearish patterns. Bullish patterns indicate a potential upward trend, while bearish patterns indicate a potential downward trend. These patterns are formed by the combination of multiple candlesticks and can provide traders with entry and exit signals.
Some common bullish candlestick patterns include the hammer, engulfing pattern, and morning star. The hammer pattern is characterized by a small body and a long lower wick, indicating that buyers are stepping in and pushing the price higher after a decline. The engulfing pattern occurs when a small bearish candle is followed by a larger bullish candle, indicating a potential reversal. The morning star pattern occurs when a small bearish candle is followed by a doji or a bullish candle, indicating a potential upward trend.
Read Also: Understanding the 12% drawdown rule: A guide to protecting your forex funds
On the other hand, bearish candlestick patterns include the hanging man, shooting star, and evening star. The hanging man pattern is similar to the hammer pattern but occurs at the top of an uptrend, indicating a potential reversal. The shooting star pattern is characterized by a small body and a long upper wick, indicating that sellers are stepping in and pushing the price lower after an uptrend. The evening star pattern occurs when a small bullish candle is followed by a doji or a bearish candle, indicating a potential downward trend.
It is important to note that candlestick patterns should not be used in isolation but in combination with other technical analysis tools. It is also crucial to consider the overall market context and other factors that may influence price movements. Regularly practicing and studying candlestick patterns will help you become more proficient in recognizing and interpreting them in real-time trading.
In conclusion, candlestick patterns are a powerful tool for traders, providing unique insights into market trends and potential price reversals. By understanding the basics of candlestick patterns and how to interpret them, traders can gain a deeper understanding of market dynamics and make more informed trading decisions.
The hammer candlestick pattern is a bullish reversal pattern that is formed at the end of a downtrend. It consists of a single candlestick that has a small body, a long lower shadow, and little to no upper shadow.
Read Also: Exploring Options on eToro: All You Need to Know
The small body of the hammer candlestick indicates that there was little movement between the opening and closing prices. The long lower shadow indicates that sellers pushed the price lower during the trading session, but buyers were able to regain control and push the price back up. The absence of an upper shadow suggests that there was little to no selling pressure.
Traders interpret the hammer candlestick pattern as a sign that the downtrend is losing momentum and that a potential reversal may be imminent. This is because the long lower shadow indicates that buyers are starting to emerge and are willing to buy at lower prices. The hammer candlestick pattern is often seen as a strong indicator of a trend reversal when it appears after a prolonged downtrend.
| Characteristics | Description |
|---|---|
| Shape | The hammer candlestick has a small body, a long lower shadow, and little to no upper shadow. |
| Color | The color of the body is not significant, but a white or green body may be more bullish. |
| Context | The hammer candlestick pattern should be preceded by a downtrend. |
| Confirmation | Traders often look for confirmation, such as a higher close or a bullish candlestick pattern on the following day. |

When trading the hammer candlestick pattern, traders often look for confirmation before entering a trade. This can include waiting for a higher close on the following day or looking for other bullish candlestick patterns. It is important to remember that no single candlestick pattern should be relied on alone, and it is recommended to consider other technical indicators and analysis before making trading decisions.
The main difference between a hammer and a hanging man candlestick pattern is their position within a trend. A hammer pattern appears at the bottom of a downtrend and signals a potential reversal to an uptrend, while a hanging man pattern appears at the top of an uptrend and signals a potential reversal to a downtrend.
A hammer candlestick pattern is characterized by a small body, a long lower shadow (at least twice the length of the body), and little to no upper shadow. This formation resembles a hammer, hence the name. It is considered a bullish reversal pattern when it appears at the bottom of a downtrend.
A hanging man candlestick pattern typically indicates a potential reversal from an uptrend to a downtrend. It is characterized by a small body near the top of the candle, a long lower shadow, and little to no upper shadow. This pattern suggests that sellers are starting to outnumber buyers, potentially leading to a downward move in price.
While hammer and hanging man patterns can provide valuable insights into potential trend reversals, they should not be considered foolproof signals. It is always important to analyze other factors and indicators, such as volume and market context, before making trading decisions based solely on candlestick patterns.

Trade in Saudi Arabia: all you need to know Trading is a vital part of the global economy, and many countries have specific regulations and …
Read Article
Is MetaTrader 5 Free to Use? MetaTrader 5 is a popular trading software used by traders all over the world. Many people wonder if it is free to use. …
Read Article
Understanding the Mechanics of LME Trading The London Metal Exchange (LME) is one of the premier global platforms for trading non-ferrous and minor …
Read Article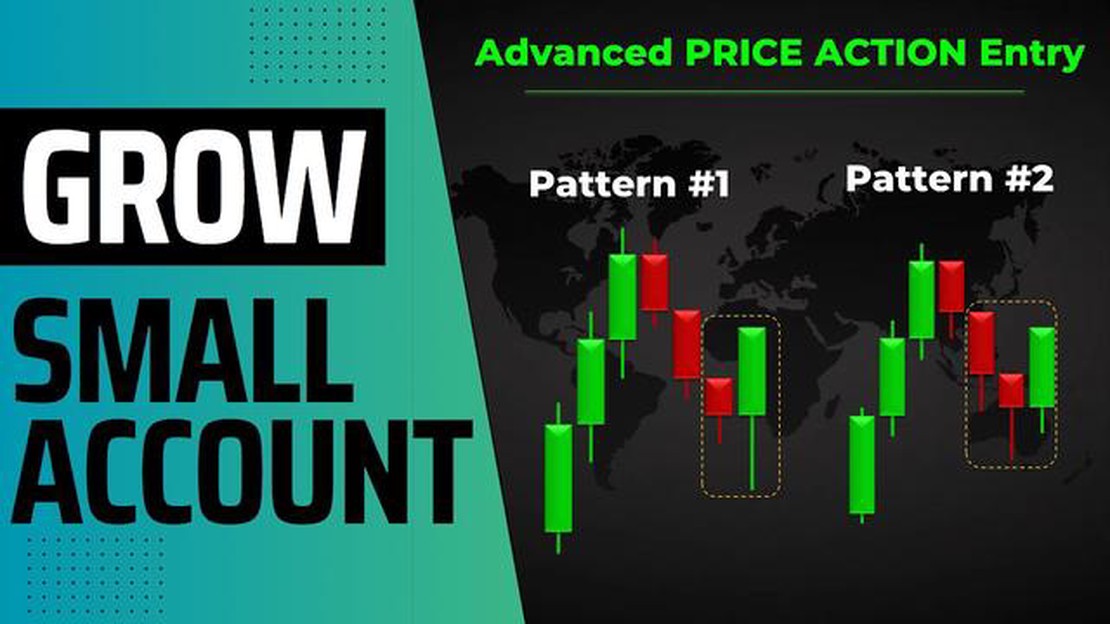
Learn Advanced Price Action Trading Strategies Price action is a fundamental concept in trading and investing. It refers to the movement and behavior …
Read Article
Understanding Managerial Stock Options Managerial stock options are commonly used as a form of incentive compensation for executives and managers. …
Read Article
Examples of Over-the-Counter (OTC) Trades Over-the-Counter (OTC) trading is a decentralized market where financial instruments, such as stocks, bonds, …
Read Article


