


How to Set Up a Moving Average Crossover Alert: Step-by-Step Guide
How to Set a Moving Average Crossover Alert Setting up a moving average crossover alert can be a useful tool for traders and investors looking to take …
Read Article
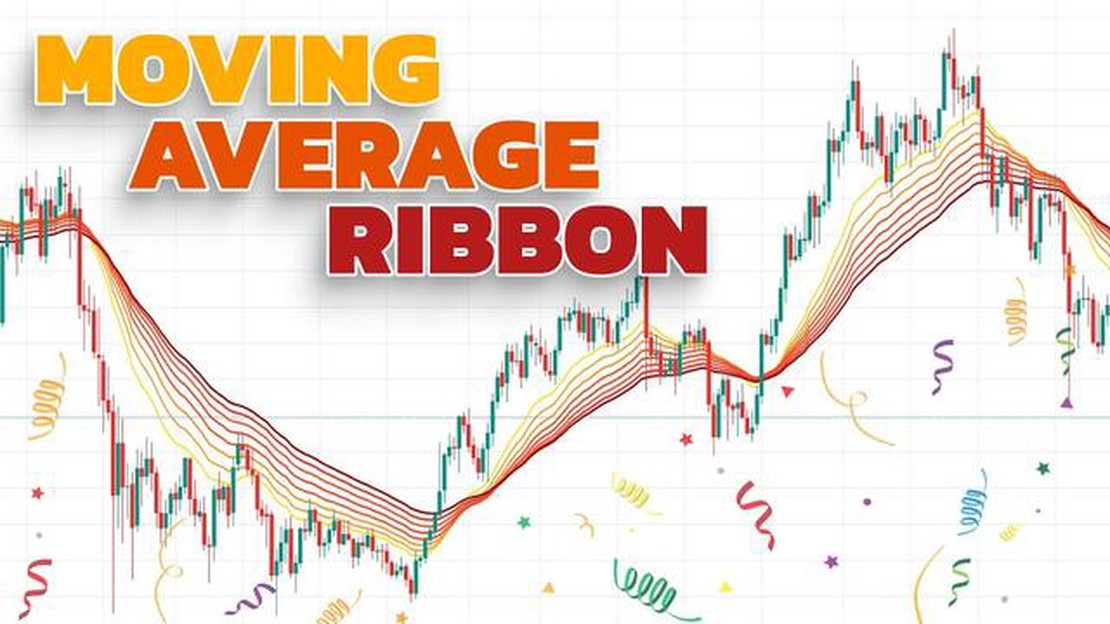
When it comes to trading, having a reliable strategy is crucial for success. One popular strategy that traders employ is the EMA Ribbon strategy. The Exponential Moving Average (EMA) Ribbon is a technical analysis tool that uses multiple EMA indicators to help identify trends and potential entry and exit points in the market.
By using a combination of different EMA periods, traders can have a clearer picture of the overall trend in the market. The EMA Ribbon consists of multiple EMA lines that are plotted on a price chart, forming a “ribbon-like” pattern. This ribbon can provide valuable insights into the strength and direction of a trend.
Traders can utilize the EMA Ribbon in various ways to develop their own trading strategies. For example, some traders may look for a crossover of the EMA lines as a signal to enter or exit a trade. Others may also consider the slope of the EMA lines or look for price action patterns to confirm their trading decisions.
However, like any trading strategy, the EMA Ribbon is not foolproof, and it is important for traders to exercise caution and proper risk management. It is essential to combine the EMA Ribbon with other technical indicators or tools and to thoroughly backtest and monitor the strategy before committing real capital.
In conclusion, the EMA Ribbon strategy is a powerful tool that can assist traders in identifying trends and potential trading opportunities. By mastering this strategy and incorporating it into their trading arsenal, traders can enhance their chances of making profitable trades in the financial markets.
The Exponential Moving Average (EMA) Ribbon is a technical analysis tool that is used to identify the direction of a trend and to generate buy and sell signals. It is created by plotting multiple exponential moving averages with different time periods on a price chart.

The EMA is a type of moving average that assigns more weight to the most recent data points, making it more responsive to short-term price changes. By using multiple EMAs with different time periods, the EMA Ribbon provides a more comprehensive view of the trend and helps to filter out the noise in the price data.
When the EMAs are plotted on a chart, they form a ribbon-like pattern that moves with the price action. The EMA Ribbon can be used to identify the strength and direction of a trend. When the ribbon is sloping upwards and the EMAs are well-separated, it indicates a strong uptrend. Conversely, when the ribbon is sloping downwards and the EMAs are close together, it indicates a strong downtrend.
In addition to trend identification, the EMA Ribbon can also generate buy and sell signals. Traders can use the crossing of the EMAs or the price crossing the ribbon as signals to enter or exit a trade. For example, a buy signal is generated when the price crosses above the ribbon, indicating a potential reversal from a downtrend to an uptrend. Conversely, a sell signal is generated when the price crosses below the ribbon, indicating a potential reversal from an uptrend to a downtrend.
Read Also: Learn How to Stack Two Images in ImageJ: Step-by-Step Guide
Overall, the EMA Ribbon is a versatile tool that can be used in various trading strategies to determine the trend direction and generate entry and exit signals. It is important to note that no trading strategy is foolproof, and it is always recommended to use the EMA Ribbon in conjunction with other technical analysis tools and risk management techniques.
Long term investments require a reliable and robust strategy that can withstand market volatility and generate consistent returns over time. The Exponential Moving Average (EMA) Ribbon is a technical analysis tool that can be used effectively for long term investment strategies. By understanding how to interpret the EMA Ribbon and implementing it into your investment approach, you can enhance your long term investment performance.
The EMA Ribbon is created by plotting multiple Exponential Moving Averages on a price chart. The EMAs are calculated using different time periods, typically ranging from 5 to 200 days. The resulting ribbon-like pattern provides valuable insights into the overall trend, support and resistance levels, and potential entry and exit points.
When using the EMA Ribbon for long term investments, it is important to identify a trend before making any investment decisions. The ribbon’s slope and alignment can help determine whether the market is trending upwards, downwards, or moving sideways. A positive slope and well-aligned EMAs indicate a bullish trend, while a negative slope and misaligned EMAs suggest a bearish trend.
Once the trend has been established, the EMA Ribbon can be used to identify potential entry and exit points for long term positions. In an uptrend, buying opportunities arise when the price pulls back and touches or closely approaches the lower end of the ribbon. This area serves as potential support, indicating that the price may bounce back up and continue the uptrend. Selling opportunities, on the other hand, can be identified when the price reaches or closely approaches the upper end of the ribbon, indicating potential resistance and a possible trend reversal.
In a downtrend, the opposite applies. Buying opportunities can be found when the price approaches the upper end of the ribbon, indicating a potential bounce back down. Selling opportunities may arise when the price touches or closely approaches the lower end of the ribbon, indicating potential resistance and a potential trend reversal.
Read Also: What does GMT stand for in forex? Understanding the importance of Greenwich Mean Time in foreign exchange trading
In addition to providing entry and exit points, the EMA Ribbon can also be used to set stop-loss orders, thereby managing risk in long term investment positions. Stop-loss orders can be placed below the lower end of the ribbon in an uptrend and above the upper end of the ribbon in a downtrend. This allows for a predetermined exit point in case the trend reverses.
It is important to note that the EMA Ribbon is not infallible and should be used in conjunction with other technical analysis tools and fundamental analysis. Long term investments require thorough research and analysis to make informed decisions. By combining the EMA Ribbon with other indicators and information, you can enhance your long term investment strategy and improve your chances of success.
In conclusion, the EMA Ribbon can be a valuable tool for long term investors. By understanding how to interpret the ribbon’s pattern, identifying trends, and using it to identify entry and exit points, you can enhance your long term investment performance. Remember to combine the EMA Ribbon with other analysis tools and perform thorough research before making any investment decisions.

The EMA (Exponential Moving Average) Ribbon is a technical analysis tool that consists of multiple exponential moving averages of different time periods plotted on the price chart. It helps to identify the direction of the trend and potential trading opportunities.
The EMA Ribbon can be used in various ways in a trading strategy. One common approach is to look for buy signals when the price is above the ribbon and the ribbon is sloping upwards, indicating a bullish trend. Conversely, sell signals can be sought when the price is below the ribbon and the ribbon is sloping downwards, indicating a bearish trend.
The choice of time periods for the exponential moving averages in the EMA Ribbon depends on the trader’s preferences and the timeframe being traded. Some traders use a combination of shorter-term and longer-term moving averages, such as 9, 21, and 50 periods. Experimentation and backtesting can help determine the most effective time periods for a specific trading strategy.
While the EMA Ribbon can be a useful tool, it has some limitations. One limitation is that it may generate false signals during periods of low volatility or when the price is moving sideways. In addition, using too many moving averages in the ribbon can make the chart overly cluttered and difficult to interpret. Traders should also be aware that moving averages are lagging indicators and may not capture sudden price changes.

How to Set a Moving Average Crossover Alert Setting up a moving average crossover alert can be a useful tool for traders and investors looking to take …
Read Article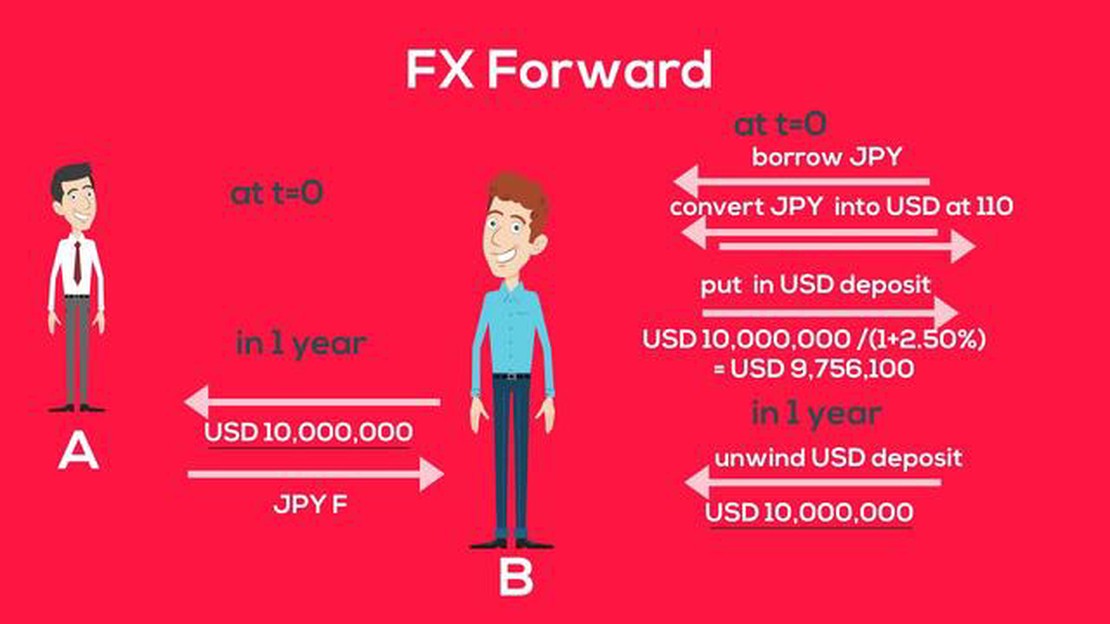
Understanding the Mechanics of FX Forwards Foreign exchange (FX) forwards are a vital tool in managing currency risk for companies and individuals …
Read Article
Understanding the Meaning of a 6 Month Average When it comes to analyzing data and making informed decisions, using averages is a common practice. One …
Read Article
Smart Trading: How to Improve Your Skills and Succeed in the Market Trading in the financial markets can be a challenging endeavor. It requires a …
Read Article
Understanding XAUUSD: What You Need to Know If you’re interested in the world of finance and investments, chances are you’ve come across the term …
Read Article
What is forex economic analysis? Forex economic analysis plays a crucial role in the financial markets as it provides traders and investors with …
Read Article
