

Discover the Current Interbank Rate for 1 GBP to PKR
What is the interbank rate for 1 GBP to PKR? When it comes to exchanging currencies, it’s important to stay updated on the current interbank rates. …
Read Article
Stochastic indicators are a crucial tool in the world of forex trading. These indicators help traders identify potential reversals and trends in the market, allowing them to make informed decisions and maximize their profits. However, mastering stochastic indicators can be a challenging task for both new and experienced traders.
This comprehensive guide aims to provide a detailed overview of stochastic indicators and their various components. From understanding the basics of stochastic oscillators to learning how to interpret the %K and %D lines, this guide will equip you with the knowledge and skills needed to effectively utilize stochastic indicators in your forex trading strategy.
By delving into the history and theory behind stochastic indicators, we lay a solid foundation for your understanding. We then move on to practical examples and case studies, demonstrating how to apply stochastic indicators to real-life trading scenarios.
Throughout this guide, we emphasize the importance of combining stochastic indicators with other technical analysis tools, such as moving averages and support/resistance levels. This holistic approach enhances the accuracy of your trading decisions and allows you to capitalize on market opportunities more effectively.
Whether you are a novice trader looking to expand your knowledge or a seasoned professional seeking to refine your skills, this comprehensive guide will serve as an invaluable resource in your journey towards mastering stochastic indicators in forex trading.
Stochastic indicators are popular technical analysis tools used by forex traders to determine potential market turning points and identify overbought or oversold conditions. They are designed to measure the momentum of price movements and compare the current price to its range over a specific period of time.

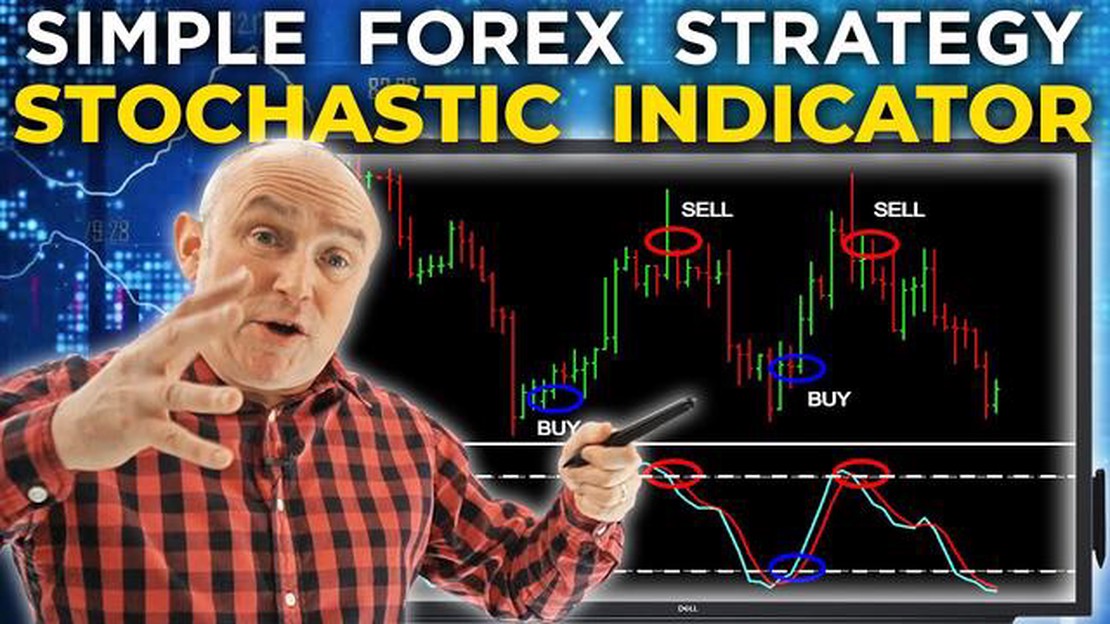
The most common stochastic indicator is the stochastic oscillator, which consists of two lines - %K and %D. The %K line represents the current price in relation to the range over a given period, while the %D line is a moving average of the %K line. Traders often use these lines to generate buy and sell signals.
Stochastic indicators are based on the concept that prices tend to close near the high during an uptrend and near the low during a downtrend. Therefore, when the %K line crosses above the %D line and both lines are below 20, it is considered a signal to buy. Conversely, when the %K line crosses below the %D line and both lines are above 80, it is considered a signal to sell.
Stochastic indicators are useful in identifying potential reversals and overbought/oversold conditions, but they should not be used in isolation. Traders often combine them with other technical analysis tools and indicators to confirm signals and make more informed trading decisions.
Stochastic indicators are essential tools used by forex traders to identify potential market reversals and generate trading signals. They are based on the idea that market trends have a tendency to reverse after reaching extreme levels of overbought or oversold conditions. By analyzing price and momentum, stochastic indicators can provide valuable insights into the strength and direction of the market.
One of the key benefits of using stochastic indicators is their ability to help traders identify market turning points. When the indicator reaches overbought levels, it suggests that the market is overextended and may be due for a downward correction. Conversely, when the indicator reaches oversold levels, it indicates that the market is oversold and may be ready for an upward rebound. These signals can be used to make informed trading decisions and take advantage of potential price reversals.
Read Also: Calculating Profit and Loss: A Simple Guide
Furthermore, stochastic indicators can also help traders assess the strength of a trend. When the indicator is trending upwards and reaching higher highs, it suggests that the market is in a strong uptrend. Conversely, when the indicator is trending downwards and reaching lower lows, it indicates that the market is in a strong downtrend. By monitoring the trend strength, traders can adjust their trading strategies accordingly and capitalize on trending markets.
In addition, stochastic indicators can be used in conjunction with other technical analysis tools to confirm trading signals. For example, traders may wait for a stochastic indicator to reach an extreme level and then look for a candlestick pattern or a trendline break to validate the potential reversal. This can help filter out false signals and improve the overall accuracy of trading decisions.
To effectively use stochastic indicators, it is important to understand their limitations and incorporate them into a comprehensive trading strategy. They should not be relied upon as a standalone indicator and should be used in combination with other technical analysis tools and fundamental analysis. By considering a range of indicators and factors, traders can make more informed and confident trading decisions.
In conclusion, stochastic indicators play a crucial role in forex trading by helping traders identify potential market reversals, assess trend strength, and confirm trading signals. By incorporating these indicators into their analysis, traders can improve their chances of success and maximize their profits in the forex market.
Read Also: Understanding the Distinctions between Momentum Trading and Swing Trading
Stochastic indicators are popular tools used by forex traders to identify potential buying or selling opportunities in the market. These indicators help traders analyze the momentum and strength of a currency pair’s price movement.
To effectively use stochastic indicators in forex trading, follow these steps:
Overall, stochastic indicators can be powerful tools when used correctly in forex trading. Understanding the basics, identifying overbought and oversold conditions, confirming with other indicators, setting the right timeframes, and applying risk management techniques are essential steps to effectively use stochastic indicators in your trading strategy.
Stochastic indicators in forex trading are technical tools that help traders identify potential trend reversals and overbought or oversold conditions in the market. They consist of two lines, %K and %D, that oscillate between 0 and 100. The %K line represents the current price level relative to the price range, while the %D line is a smoothed version of the %K line. Traders can use stochastic indicators to generate buy or sell signals when the lines cross over certain levels.
Stochastic indicators work by comparing the closing price of a currency pair to its price range over a specific period of time. This helps identify whether the market is overbought or oversold. When the %K line crosses above the %D line and both lines are below a certain threshold (e.g., 20), it indicates a potential buy signal. On the other hand, when the %K line crosses below the %D line and both lines are above a certain threshold (e.g., 80), it indicates a potential sell signal. Traders can adjust the thresholds based on their risk tolerance and market conditions.

Stochastic indicators can be reliable in forex trading when used in conjunction with other technical analysis tools and market indicators. While they can help identify potential trend reversals and overbought/oversold conditions, it’s important to consider other factors such as market fundamentals, trend lines, and support/resistance levels. Traders should also be aware that stochastic indicators can sometimes generate false signals, especially in ranging or choppy markets. Therefore, it’s crucial to use stochastic indicators as a part of a comprehensive trading strategy.
Using stochastic indicators in forex trading offers several advantages. Firstly, they can help identify potential trend reversals before they become apparent on price charts. This allows traders to enter the market at an early stage of a new trend, potentially maximizing profits. Secondly, stochastic indicators can help identify overbought or oversold conditions, which can be useful for identifying potential areas of price reversal. Lastly, stochastic indicators are easy to interpret and can be applied to any time frame, making them versatile tools for traders.
Yes, stochastic indicators can be used in conjunction with other technical indicators to enhance the accuracy of trading signals. For example, traders often use stochastic indicators together with trend lines, moving averages, or support/resistance levels to confirm potential trade entries or exits. By combining different indicators, traders can obtain a more comprehensive view of the market and reduce the likelihood of false signals. However, it’s essential to avoid using too many indicators as it can lead to analysis paralysis and confusion.
Stochastic indicators in forex trading are mathematical calculations used to determine the momentum and strength of a currency pair’s price movement. They compare the closing price of a currency pair to its price range over a specific period of time to identify potential overbought or oversold conditions.
Stochastic indicators are calculated using the following formula: %K = 100 * (C - L14) / (H14 - L14), where %K represents the current closing price, C is the most recent closing price, L14 is the lowest price in the past 14 periods, and H14 is the highest price in the past 14 periods. The resulting %K value is plotted on a scale from 0 to 100 to generate the stochastic indicator.

What is the interbank rate for 1 GBP to PKR? When it comes to exchanging currencies, it’s important to stay updated on the current interbank rates. …
Read Article
Understanding the High Low Moving Average Indicator When it comes to trading, one of the most important tools in a trader’s arsenal is the moving …
Read Article
Number of Forex Traders Worldwide Forex trading, also known as foreign exchange trading, has gained significant popularity over the years. It is a …
Read Article
Is AIMS Forex Legit? AIMS Forex, a popular trading platform, has gained attention from both experienced and new traders. However, with the vast number …
Read Article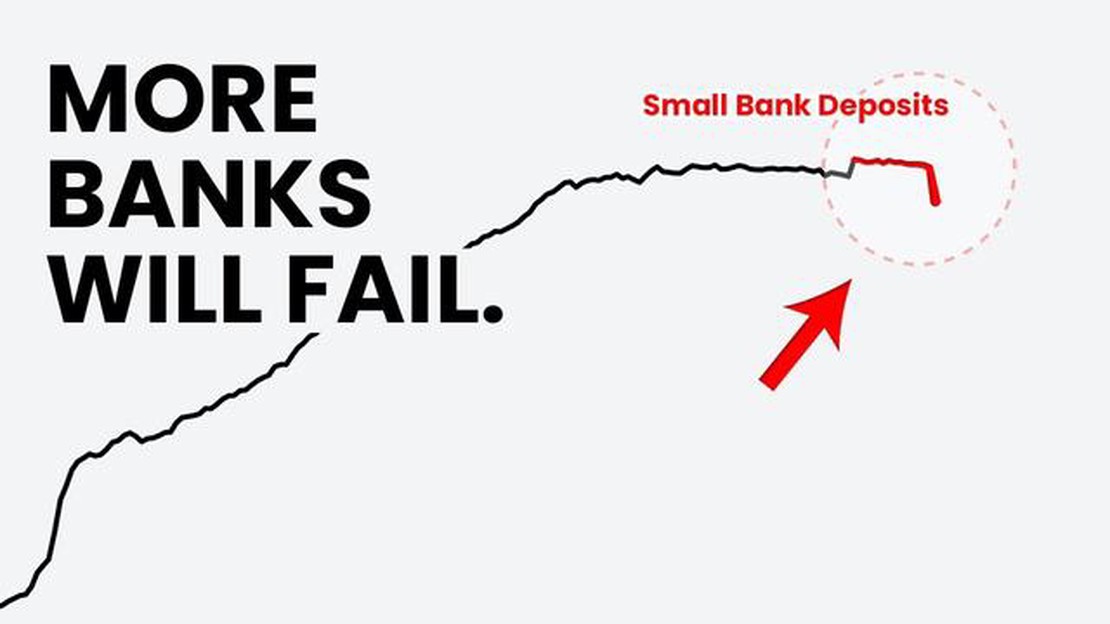
The Causes and Effects of the 2023 Banking Crisis In 2023, the global economy was thrown into turmoil as a result of a severe banking crisis. This …
Read Article
Trading Options on TradeStation If you’re a trader looking to explore the world of options, you may be wondering if you can trade options on …
Read Article


