

Smoothing Techniques Used in Forecasting: An Overview
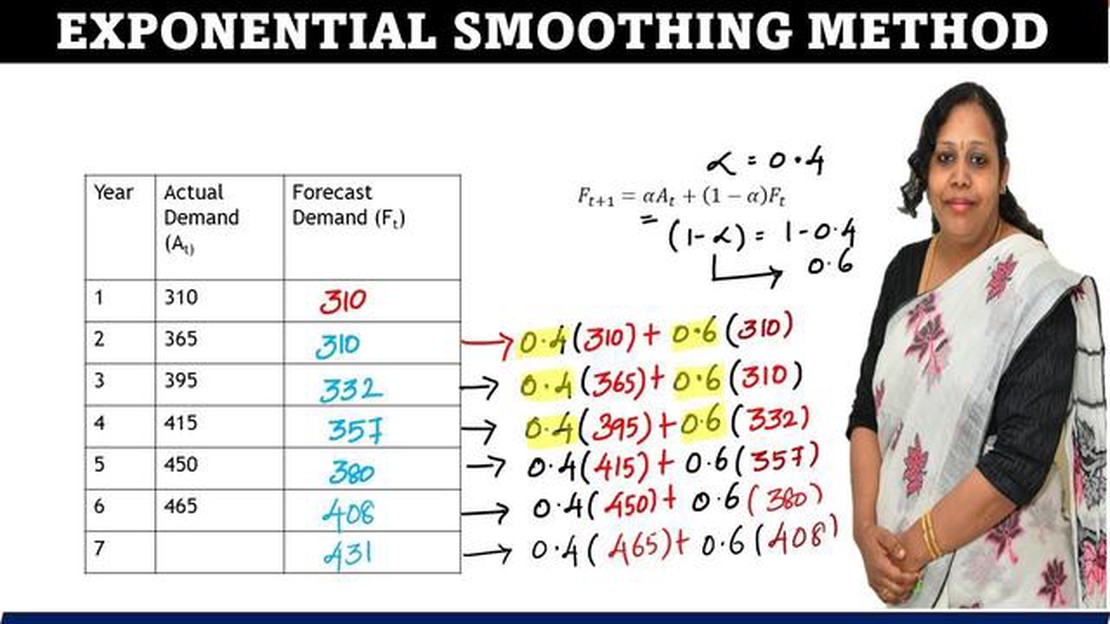
What are the smoothing techniques used in forecasting? In the field of forecasting, accuracy is crucial for businesses to make informed decisions. …
Read Article
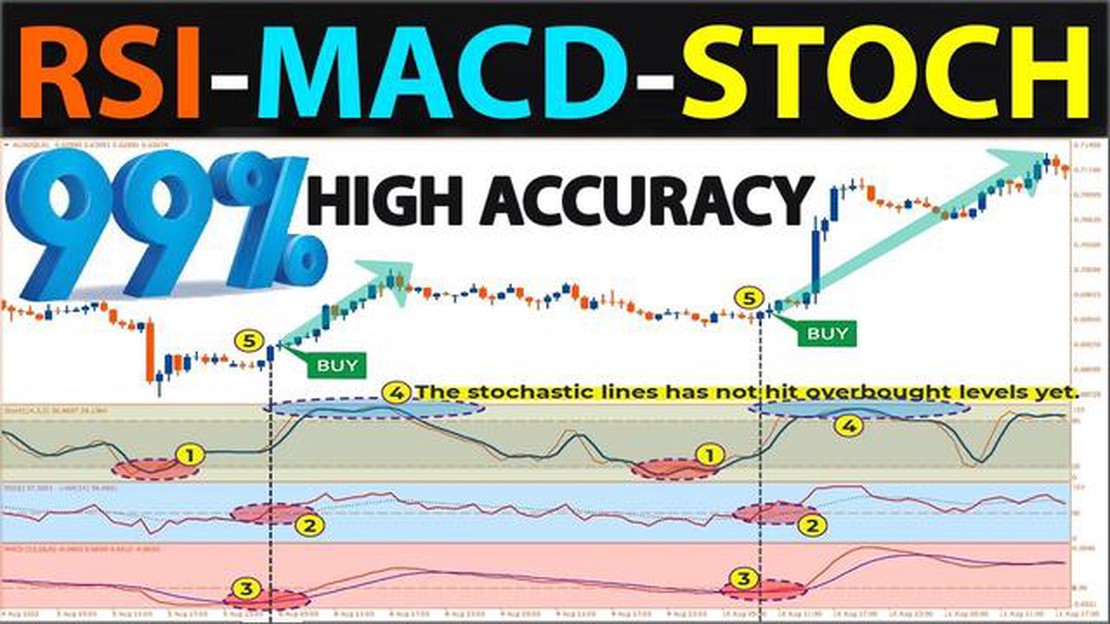
Technical indicators are essential tools for traders and investors in the financial markets. They help to analyze price data and identify potential trends and reversals. Three of the most commonly used indicators are Moving Average Convergence Divergence (MACD), Relative Strength Index (RSI), and Stochastic.
MACD is a trend-following momentum indicator that shows the relationship between two moving averages of an asset’s price. It consists of a MACD line, a signal line, and a histogram. Traders use MACD to identify bullish or bearish crossovers, as well as divergences, which can signal potential reversals.
RSI is a popular oscillator that measures the speed and change of price movements. It ranges from 0 to 100 and is commonly used to identify overbought or oversold conditions in an asset. Traders often look for divergences between price and RSI to confirm potential reversals.
Stochastic is another oscillator that compares the closing price of an asset to its price range over a certain period of time. It also ranges from 0 to 100 and helps to identify overbought or oversold conditions. Traders use Stochastic to spot potential trend reversals when the indicator reaches extreme levels and starts to turn.
While each indicator has its strengths and weaknesses, there is no definitive answer to which one works best. Traders and investors often use a combination of indicators to confirm signals and make informed decisions. It is important to understand the strengths and limitations of each indicator and how they can be applied to different market conditions.
Ultimately, the effectiveness of these indicators depends on various factors, including the market being traded, the time frame analyzed, and the trader’s individual trading strategy. It is important to conduct thorough research, backtesting, and experimentation to determine which indicators and settings work best for one’s own trading style and goals.
In conclusion, MACD, RSI, and Stochastic are all valuable technical indicators that can help traders and investors make informed decisions in the financial markets. By understanding how these indicators work and incorporating them into a well-rounded trading strategy, individuals can increase their chances of success in the dynamic and ever-changing world of trading.

MACD Indicator:
Read Also: Equation for the Autoregressive Moving Average Model
RSI Indicator:
Stochastic Indicator:
The Moving Average Convergence Divergence (MACD) is a popular technical analysis indicator used by traders to identify potential trend reversals, gauge the strength of a current trend, and generate buy and sell signals. It is based on the concept of moving averages and divergence.
The MACD consists of three components: the MACD line, the signal line, and the histogram. The MACD line is calculated by subtracting the 26-day exponential moving average (EMA) from the 12-day EMA. The signal line, also known as the trigger line, is a 9-day EMA of the MACD line. The histogram represents the difference between the MACD line and the signal line.
The MACD indicator is presented as a line chart that oscillates above and below a zero line. When the MACD line crosses above the signal line, it is considered a bullish signal, indicating a potential buy opportunity. Conversely, when the MACD line crosses below the signal line, it is considered a bearish signal, indicating a potential sell opportunity.
The MACD is also used to identify divergences, which can signal trend reversals. A bullish divergence occurs when the price makes a lower low while the MACD makes a higher low. This suggests that the selling pressure is weakening, and a bullish reversal may be imminent. On the other hand, a bearish divergence occurs when the price makes a higher high while the MACD makes a lower high. This suggests that the buying pressure is weakening, and a bearish reversal may be imminent.
Traders often use the MACD in conjunction with other technical indicators to confirm signals and make more informed trading decisions. It is important to note that the MACD is not infallible and should be used in conjunction with other forms of analysis and risk management strategies.
MACD stands for Moving Average Convergence Divergence. It is a trend-following momentum indicator that shows the relationship between two moving averages of an asset’s price. The MACD is calculated by subtracting the 26-day exponential moving average (EMA) from the 12-day EMA. A 9-day EMA of the MACD line is then plotted as a signal line. Traders use the MACD to identify potential buy and sell signals.
Read Also: Understanding the Concept of Forex Growth: Learn About the Potential of Forex Trading
RSI stands for Relative Strength Index. It is a momentum oscillator that measures the speed and change of price movements. The RSI ranges from 0 to 100 and is typically used to identify overbought or oversold conditions in an asset. The RSI is calculated by comparing the magnitude of recent gains to recent losses over a specified period of time. Traders use the RSI to determine whether an asset is overvalued or undervalued.

The Stochastic oscillator is a momentum indicator that compares an asset’s closing price to its price range over a specified period of time. The Stochastic oscillator consists of two lines: %K and %D. The %K line represents the level of the asset’s current closing price relative to its price range, while the %D line is a moving average of the %K line. Traders use the Stochastic oscillator to identify overbought or oversold conditions and potential trend reversals.
All three indicators – MACD, RSI, and Stochastic – can be used to identify trends in the market. However, the MACD is particularly effective in this regard as it is specifically designed to identify the strength and direction of a trend. The MACD histogram can provide valuable insight into whether a trend is gaining or losing momentum. Traders often use the MACD in combination with other indicators to confirm trends.
Both the RSI and Stochastic indicators are commonly used to identify overbought or oversold conditions. The RSI measures the magnitude of recent gains and losses, and values above 70 typically indicate overbought conditions, while values below 30 indicate oversold conditions. The Stochastic oscillator, on the other hand, compares the closing price to the price range and values above 80 indicate overbought conditions, while values below 20 indicate oversold conditions. Traders can choose the indicator that they feel is most effective for their trading strategy.
MACD stands for Moving Average Convergence Divergence. It is a trend-following momentum indicator that shows the relationship between two moving averages of a security’s price. It is calculated by subtracting the 26-day exponential moving average from the 12-day exponential moving average. The result is then plotted on a chart as a line that oscillates around zero. Traders use MACD to identify potential buy and sell signals, as well as to gauge the strength of a trend.
RSI stands for Relative Strength Index. It is a momentum oscillator that measures the speed and change of price movements. RSI ranges from 0 to 100 and is typically considered overbought when it is above 70 and oversold when it is below 30. Traders can use RSI to identify potential trend reversals and to generate buy or sell signals. For example, if the RSI is in the oversold territory and starts to move upward, it can indicate that the security is potentially undervalued and may be a good buying opportunity.

What are the smoothing techniques used in forecasting? In the field of forecasting, accuracy is crucial for businesses to make informed decisions. …
Read Article
Best Personal Calendar App for iPhone: Find Your Perfect Organizer In today’s fast-paced world, staying organized is key to managing our busy lives. …
Read Article
Best Places to Trade OTC Options If you’re interested in trading over-the-counter (OTC) options, you’ll need to find a platform that offers this type …
Read Article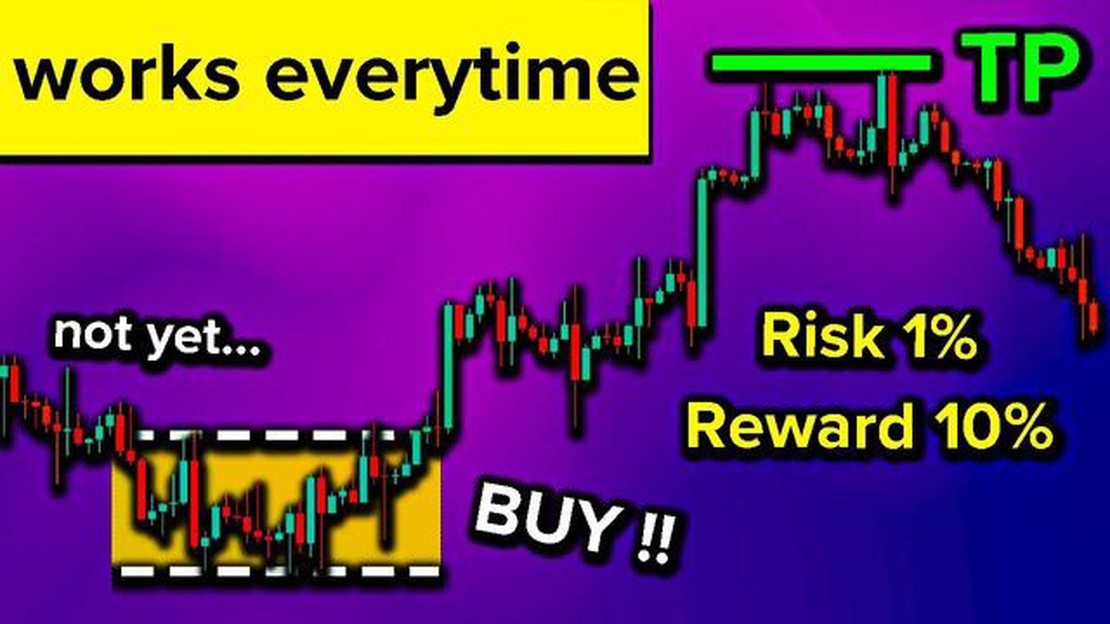
How to Predict Buy or Sell Signals in Forex Trading Forex trading is a highly volatile and dynamic market, where prices can change rapidly within …
Read Article
Find the Broker with the Lowest Option Fees Find the broker with the lowest option fees Compare and choose the best options trading platform When it …
Read Article
Understanding Delta, Gamma, Theta, and Vega in Options Options trading can be a complex and risky endeavor, but understanding the concepts of delta, …
Read Article


