


Choosing the Right UML Diagram: A Comprehensive Guide
Choosing the Right UML Diagram: A Guide to Help You Decide Unified Modeling Language (UML) is a visual tool used for modeling software systems. It …
Read Article
When it comes to successful trading, having a solid strategy is key. One popular strategy that many traders use is the 200-day exponential moving average (EMA) strategy. The 200-day EMA is a technical indicator that helps traders identify trends and potential entry and exit points in the market.
The 200-day EMA strategy is based on the principle that long-term trends are more reliable than short-term fluctuations. By using the 200-day EMA, traders can filter out noise and focus on the overall direction of the market. This can help them make better trading decisions and increase their chances of success.
Traders can use the 200-day EMA strategy in various ways. One common approach is to buy when the price crosses above the 200-day EMA and sell when it crosses below. This strategy allows traders to enter trades in the direction of the trend and exit when the trend starts to reverse.
While the 200-day EMA strategy can be effective, it is important to remember that no strategy is foolproof. Traders should always do their own research and analysis before making any trading decisions. Additionally, risk management is crucial to mitigate potential losses and protect capital.
Overall, the 200-day EMA strategy is a powerful tool in a trader’s arsenal. By using this strategy, traders can gain a better understanding of market trends and improve their chances of success. However, it is important to use this strategy in conjunction with other indicators and analysis to make informed trading decisions.
The 200-day EMA (Exponential Moving Average) strategy is a commonly used trading strategy that helps traders identify trends in the market. The strategy utilizes the 200-day EMA, which is a moving average that puts more weight on recent prices, thereby providing a smoother line that reflects the longer-term trend.
The basic idea behind this strategy is to buy when the price of an asset is above the 200-day EMA and sell when the price falls below it. The 200-day EMA acts as a support level when the price is above it and a resistance level when the price is below it. By following the 200-day EMA, traders can ride the trend and potentially capture larger profits.
One of the main advantages of using the 200-day EMA strategy is its simplicity. Traders don’t need to use complex technical indicators or understand intricate trading theories. Instead, they can rely on the 200-day EMA as a straightforward tool to determine their buying and selling decisions.

However, it’s important to note that the 200-day EMA strategy is not foolproof and may not work in all market conditions. It is always recommended to use other technical indicators or analysis methods to confirm the signals provided by the 200-day EMA. Additionally, it’s crucial to consider other factors such as market volatility, news events, and overall market sentiment when executing trades using this strategy.
Overall, the 200-day EMA strategy is a widely followed trading strategy that can help traders identify trends and potentially generate profits. By understanding the basics of this strategy and combining it with other analysis techniques, traders can enhance their decision-making process and increase their chances of success in the market.
Read Also: Discovering the Top Sources for Penny Stock Lists |
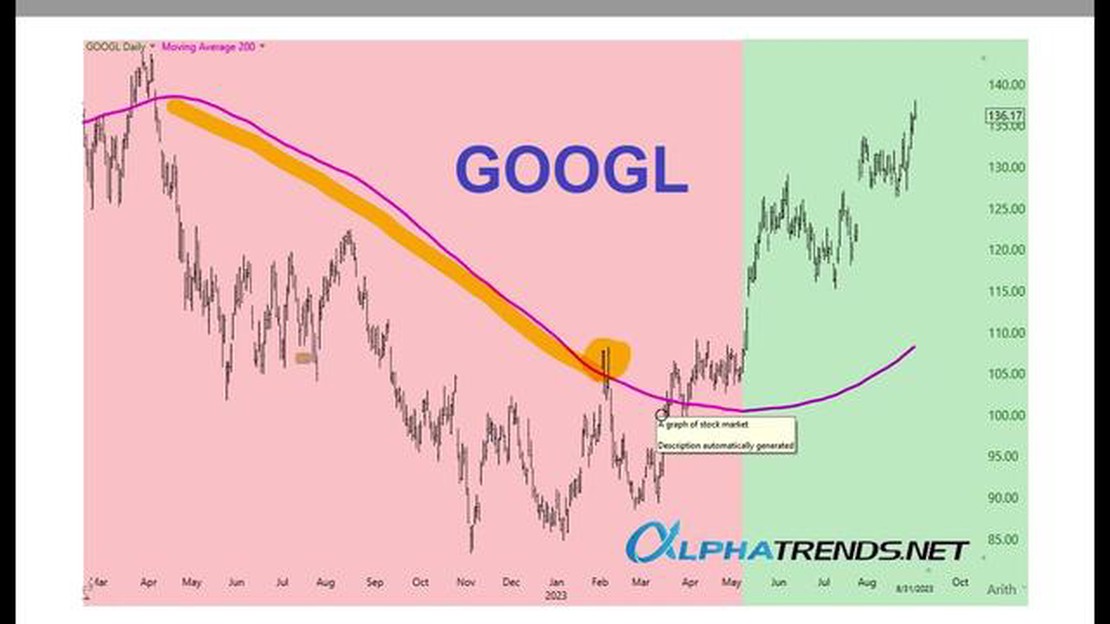
Successful traders often rely on different strategies to make informed investment decisions and maximize their profits. One such strategy is the 200-day Exponential Moving Average (EMA) strategy. This approach involves analyzing the 200-day EMA line on a stock or market index chart to identify potential buy or sell signals.
The 200-day EMA is a popular technical indicator used by traders to assess the overall trend of a stock or market index. It calculates the average price of a security over the past 200 trading days, with greater weight given to more recent prices. Traders believe that the 200-day EMA reflects the long-term trend and can help identify support and resistance levels.
To implement the 200-day EMA strategy, traders first plot the 200-day EMA line on a stock or market index chart. They then observe the price’s interaction with this line. If the price of the security crosses above the 200-day EMA line, it is considered a bullish signal, indicating a potential buying opportunity. Conversely, if the price crosses below the 200-day EMA line, it is seen as a bearish signal, suggesting a possible selling opportunity.
However, it’s important to note that using the 200-day EMA strategy alone is not sufficient to guarantee successful trading outcomes. Traders should combine this strategy with other technical indicators, such as volume analysis, relative strength index (RSI), or moving average convergence divergence (MACD), to gain a more comprehensive understanding of the market.
Moreover, traders need to exercise caution and avoid making impulsive trading decisions solely based on the 200-day EMA signals. It’s crucial to analyze other aspects, such as fundamental analysis of the company, market conditions, and upcoming events, before executing any trades. Additionally, setting stop-loss orders and profit targets can help mitigate potential losses and protect profits.
In conclusion, implementing the 200-day EMA strategy can be a valuable tool for successful trading. By paying attention to the price’s interaction with the 200-day EMA line and combining it with other technical indicators and fundamental analysis, traders can make more informed investment decisions and increase their chances of achieving profitable outcomes.
The 200-day Exponential Moving Average (EMA) strategy is a popular tool used by traders to identify trends and make informed trading decisions. This strategy offers several benefits that can enhance a trader’s chances of successful trading.
1. Long-term trend identification: The 200-day EMA is commonly used to determine the long-term trend of an asset. By analyzing whether the price is above or below the 200-day EMA, traders can identify the overall direction of the market. This helps traders avoid making trades against the prevailing trend, increasing their chances of success.
Read Also: Strategies to predict the next candle in binary options trading
2. Reliable support and resistance levels: The 200-day EMA often acts as a significant support or resistance level for an asset. As the price approaches the 200-day EMA, it can bounce off or break through this level, indicating potential buying or selling opportunities. Traders can use this information to set their stop-loss and take-profit levels, improving their risk management.
3. Enhanced accuracy with higher time frames: The 200-day EMA strategy is most effective when applied to higher time frames, such as daily or weekly charts. Using longer time frames reduces the impact of market noise and provides more reliable signals. This increases the accuracy of the strategy and reduces the likelihood of false trading signals.

4. Confirmation of other technical indicators: The 200-day EMA can be used in conjunction with other technical indicators to confirm trade signals. For example, if a trader sees a bullish crossover of the 50-day EMA above the 200-day EMA, it can be considered a stronger buy signal. This helps traders make more confident trading decisions based on multiple indicators aligning.
5. Flexibility for different trading styles: The 200-day EMA strategy is versatile and can be applied to different trading styles. Whether a trader prefers long-term trend following or shorter-term swing trading, the 200-day EMA can provide valuable insights into market trends. Traders can adjust their entry and exit strategies based on their preferred time horizon, maximizing their potential profits.
In conclusion, the 200-day EMA strategy offers several benefits that can improve a trader’s trading performance. By identifying long-term trends, providing support and resistance levels, enhancing accuracy with higher time frames, confirming other technical indicators, and accommodating different trading styles, this strategy can significantly enhance a trader’s chances of success in the financial markets.
The 200-day EMA strategy is a trading approach that uses the 200-day exponential moving average (EMA) as a benchmark for making buy or sell decisions in the stock market. Traders who follow this strategy typically buy when the price of a security crosses above the 200-day EMA and sell when it crosses below it.
The 200-day EMA strategy works by analyzing the long-term trend of a security. When the price is above the 200-day EMA, it indicates a bullish trend, signaling traders to buy. Conversely, when the price is below the 200-day EMA, it indicates a bearish trend, signaling traders to sell. By using this strategy, traders aim to capture the majority of a trend while filtering out short-term fluctuations.
The 200-day EMA strategy is generally suitable for trending markets, where the price of a security is moving consistently in one direction. During sideways or choppy markets, the strategy may generate false signals and result in losses. Therefore, it is important for traders to assess the market conditions and adapt their strategies accordingly.
While the 200-day EMA strategy can be effective in trending markets, it has its limitations. One limitation is that it may result in delayed entries or exits. Since the strategy relies on the price crossing the 200-day EMA, traders may miss out on some potential profits or incur larger losses if the price reverses quickly. Additionally, the strategy may not work well in volatile markets where the price fluctuates significantly above and below the 200-day EMA.

Choosing the Right UML Diagram: A Guide to Help You Decide Unified Modeling Language (UML) is a visual tool used for modeling software systems. It …
Read Article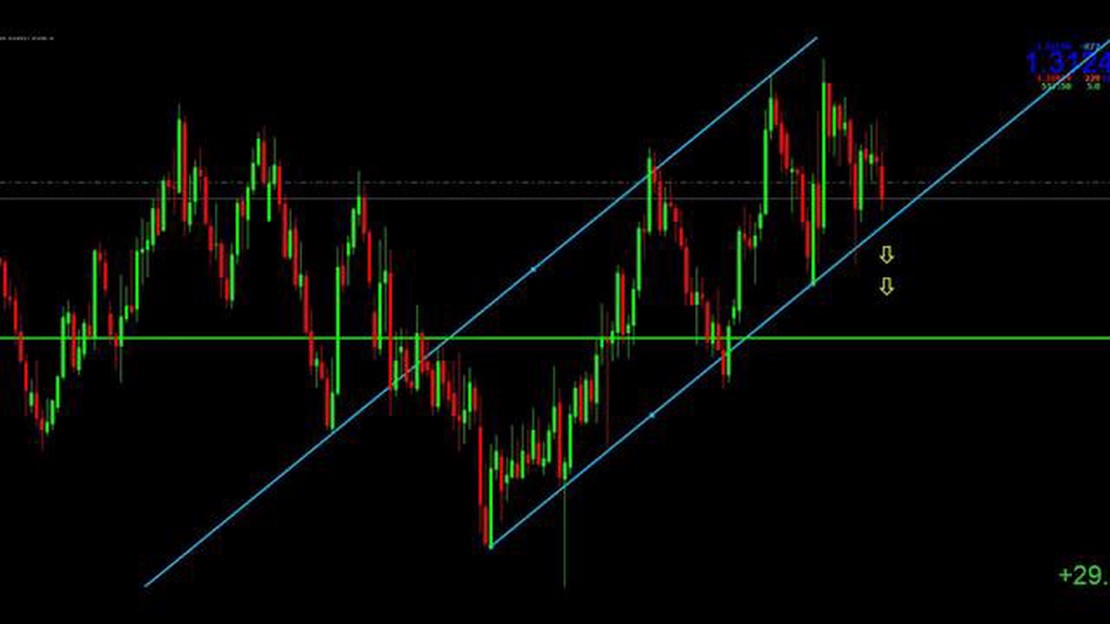
Mastering the Equidistant Channel in Forex Trading If you are new to forex trading, you may have come across various technical analysis tools and …
Read Article
Can You Get Rich with Forex Trading? Forex trading, also known as foreign exchange trading, is a popular investment opportunity that allows …
Read Article
What is the best forex to trade now? Forex trading is a popular investment option that allows individuals to trade currencies from around the world. …
Read Article
Is FBS spread good? When it comes to trading on FBS, one of the key factors to consider is the spread. The spread refers to the difference between the …
Read Article
Understanding the Moving Average Cross Dashboard Are you looking to take your trading strategy to the next level? Look no further than the Moving …
Read Article


