


Find the Phone Number of Dubai Embassy: Everything You Need to Know
The Phone Number of Dubai Embassy If you are planning a trip to Dubai and you need to contact the embassy for any reason, it is important to have …
Read Article
The Bollinger Bands are a widely used technical indicator in financial analysis. They were developed by John Bollinger in the 1980s and are used to identify potential price reversals and volatility in the financial markets. In this step-by-step guide, we will learn how to code Bollinger Bands in Python.
Bollinger Bands consist of three lines: the upper band, the lower band, and the middle band. The middle band is a simple moving average (SMA) of the price over a specified period, usually 20 days. The upper and lower bands are calculated by adding and subtracting a multiple of the standard deviation from the middle band.
Coding Bollinger Bands in Python involves using libraries such as Pandas and Numpy for data manipulation and calculation, as well as Matplotlib for visualizations. We will walk through the process step by step, starting from importing the necessary libraries and loading the data, to calculating the moving average, standard deviation, and plotting the Bollinger Bands.
Before we begin, make sure you have Python installed on your computer, along with the necessary libraries. It is also helpful to have a basic understanding of Python programming and data manipulation.
Now, let’s dive into the coding process and learn how to implement Bollinger Bands in Python!
The Bollinger Bands are a technical analysis tool that was developed by John Bollinger in the 1980s. They are used to measure volatility and identify potential price reversals in the financial markets.
The Bollinger Bands consist of three lines: the upper band, the lower band, and the middle band. The middle band is usually a simple moving average of the stock’s price over a specified period. The upper and lower bands are positioned above and below the middle band, with a distance determined by the stock’s volatility.
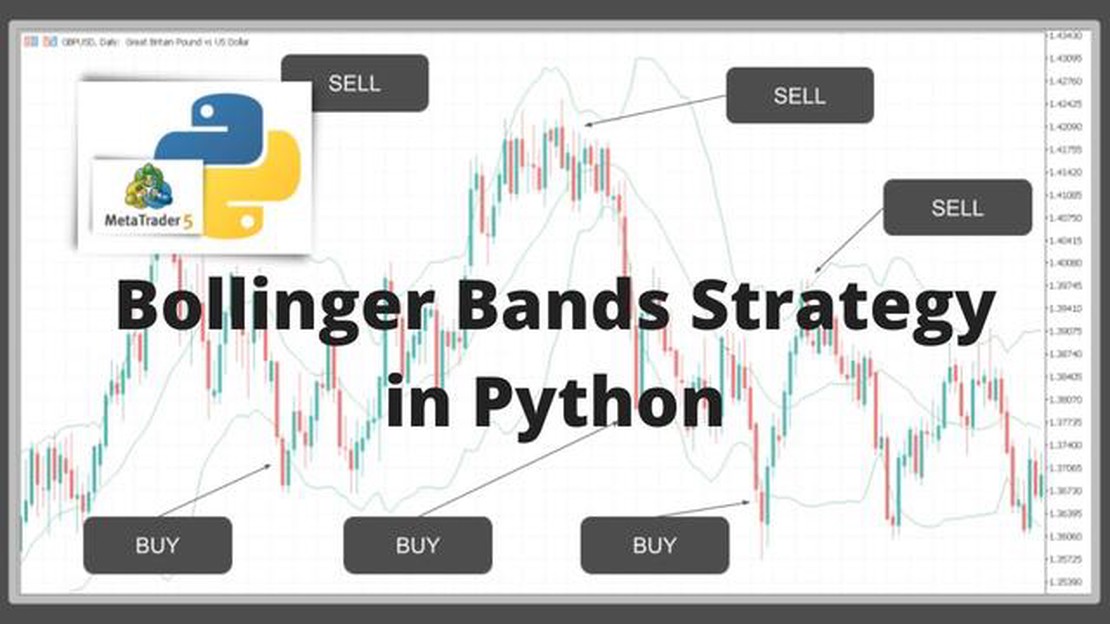
The significance of the Bollinger Bands lies in their ability to provide valuable information about the market conditions. When the stock’s price is trading near the upper band, it indicates that the market is overbought and the price may be due for a correction or a reversal. On the other hand, when the price is trading near the lower band, it suggests that the market is oversold and the price may be due for a bounce or a rally.
Traders and investors can use the Bollinger Bands to generate trading signals. For example, when the price penetrates the upper band, it can be a signal to sell or take profits. Conversely, when the price penetrates the lower band, it can be a signal to buy or enter a long position. These signals are further confirmed when accompanied by other technical indicators or patterns.
Read Also: Who is the owner of KBC? Find out the answer here
It is important to note that the Bollinger Bands are not foolproof and should be used in conjunction with other tools and analysis. They are most effective when used in trending markets, as they may produce false signals in sideways or choppy markets. Additionally, it is crucial to set proper parameters for the Bollinger Bands based on the specific security being analyzed and the desired time frame.
In conclusion, the Bollinger Bands are a widely used technical analysis tool that can help traders and investors identify potential reversal points and manage their trades. By understanding the significance of the Bollinger Bands and how to interpret them, individuals can make more informed trading decisions and increase their chances of success in the financial markets.
To code Bollinger Bands in Python, we need to import the necessary libraries that will help us perform the calculations and create plots. The following libraries are required:
To import these libraries, we can use the following code:
Read Also: Choosing the Right Algorithm for Successful Trading
import pandas as pdimport numpy as npimport matplotlib.pyplot as plt
After importing these libraries, we are ready to move on to the next step, which is loading the data and calculating the Bollinger Bands.
Note: Make sure you have these libraries installed in your Python environment before running the code.
To start coding the Bollinger Band indicator in Python, you need to set up your Python environment. Follow the steps below to get started:
python -m venv myenv to create a new virtual environment named “myenv”. Activate the virtual environment by running the command source myenv/bin/activate on Linux/Mac or myenv\Scripts\activate on Windows.pip install pandas numpy matplotlib.Once you have completed these steps, you should have a working Python environment ready for coding the Bollinger Band indicator. In the next section, we will start implementing the indicator logic using the installed libraries.
A Bollinger Band is a popular technical analysis tool that is used to measure volatility in the financial markets. It consists of three bands: an upper band, a middle band, and a lower band. The middle band is a simple moving average, while the upper and lower bands are standard deviations above and below the middle band, respectively. Traders use Bollinger Bands to identify potential price reversals and to gauge market volatility.

You can code Bollinger Bands in Python by using the numpy and matplotlib libraries. First, you need to calculate the middle band, which is a simple moving average. Then, you calculate the standard deviation and multiply it by a factor to determine the distance of the upper and lower bands from the middle band. Finally, you plot the bands and the price data using matplotlib. The article provides a step-by-step guide and code examples to help you implement the Bollinger Bands in Python.
Yes, Bollinger Bands can be used for various types of analysis. Apart from identifying potential price reversals and measuring market volatility, Bollinger Bands can also be used to determine trade entry and exit points. Traders can look for price breakouts from the bands or wait for the price to bounce off the bands before making a trading decision. Bollinger Bands can also be combined with other technical indicators to create a more comprehensive trading strategy.
Bollinger Bands can be used in various financial markets, including stocks, forex, commodities, and cryptocurrencies. However, their effectiveness may vary depending on the characteristics of the market. For highly volatile markets, the bands may expand, providing wider trading ranges. In less volatile markets, the bands may contract, indicating a period of low volatility. Traders should consider the specific characteristics of the market they are trading and adjust the parameters of the Bollinger Bands accordingly.

The Phone Number of Dubai Embassy If you are planning a trip to Dubai and you need to contact the embassy for any reason, it is important to have …
Read Article
Reserve Requirements in Mexico: What You Need to Know Reserve requirements are an important tool used by central banks to manage the money supply and …
Read Article
Understanding USD CNH: Definition, Features, and Significance The USD CNH currency pair refers to the exchange rate between the United States dollar …
Read Article
Understanding the Debt of KGC: A Comprehensive Analysis Debt is a ubiquitous part of the financial world, and understanding it is essential for …
Read Article
What is the best RSI setting for day trading forex? When it comes to day trading forex, one of the most popular technical indicators used by traders …
Read Article
Is Questrade a CFD? Questrade is a popular online brokerage platform that offers a range of investment options for traders. One question that often …
Read Article


