


Learn Options Trading Examples with Expert Strategies
Examples of Options Trading Options trading can be a complex and intimidating field to navigate, but with the right knowledge and strategies, it can …
Read Article
When it comes to trading, one of the most important tools in a trader’s arsenal is the moving average. This technical indicator helps traders identify trends and potential trading opportunities. However, there are different types of moving averages, and one that traders often overlook is the High Low Moving Average (HLMA).
The HLMA differs from other moving averages because it takes into account the highs and lows of the price instead of just the closing prices. By including this additional information, the HLMA provides a more robust and accurate representation of the market’s movements.
Traders can utilize the HLMA in various ways. Firstly, it helps identify support and resistance levels by smoothing out the price data. This allows traders to see the underlying trend and potential areas of price reversal. Additionally, the HLMA can be used to generate buy and sell signals, especially when combined with other technical indicators.
The HLMA is particularly useful for traders who want to avoid false signals. Its ability to filter out market noise and focus on the key price levels makes it a valuable tool in a trader’s strategy.
Overall, the High Low Moving Average is a powerful indicator that offers traders valuable insights into market trends and potential trading opportunities. By considering both the highs and lows of the price, it provides a more comprehensive view of market movements. Traders who incorporate the HLMA into their strategy can gain a competitive edge and make more informed trading decisions.
The High Low Moving Average (HLMA) is a powerful technical indicator that is commonly used by traders to identify trends and potential reversals in the financial markets. It is derived from the traditional moving average, which is a widely used indicator in technical analysis.
The HLMA differs from the traditional moving average as it calculates the average of the highest and lowest prices within a specific period. This helps to smooth out the price data and provides a clearer picture of the overall market trend.

The HLMA is calculated by adding the highest and lowest prices of a specific time period and then dividing the sum by two. This average is then plotted on a chart, creating a line that represents the HLMA.
The HLMA is often used in conjunction with other technical indicators and chart patterns to confirm trading signals or to spot potential trend reversals. Traders can also use the HLMA to identify support and resistance levels, as well as to determine entry and exit points for their trades.
One of the key advantages of using the HLMA is its ability to filter out market noise and provide a smoother representation of price movements. This can be particularly helpful in volatile markets where prices can fluctuate rapidly.
In summary, the High Low Moving Average Indicator is a popular and powerful tool used by traders to analyze market trends and identify potential reversals. By calculating the average of the highest and lowest prices over a specific period, the HLMA provides a clearer picture of the market’s overall direction.
The High Low Moving Average (HLMA) indicator is a powerful tool that can provide valuable insights to traders. Here are some key benefits of using the HLMA indicator:
Read Also: Why Do Traders Use Fibonacci? Discover the Power of Fibonacci in Trading
| 1. Enhanced Trend Identification | By calculating the moving average based on the high and low prices, the HLMA indicator provides a smoother and more accurate representation of the underlying trend compared to traditional moving averages that use only the closing price. This helps traders in identifying the direction of the trend more effectively. |
| 2. Reduced Noise | Due to its unique calculation method, the HLMA indicator filters out the noise and volatility in the price data. This enables traders to focus on the essential price movements and avoid getting distracted by insignificant fluctuations, resulting in clearer and more reliable trading signals. |
| 3. Early Entry and Exit Signals | The HLMA indicator has the ability to generate early entry and exit signals. As the indicator is more responsive to price changes, it can identify potential trend reversals or breakouts sooner than other indicators. This can give traders an advantage by allowing them to enter or exit positions earlier, maximizing their profit potential. |
| 4. Versatile Application | The HLMA indicator can be applied to various markets and timeframes, making it a versatile tool for traders. It can be used for day trading, swing trading, or long-term investing, providing valuable insights in different trading scenarios. Traders can customize the indicator’s parameters to suit their trading style and preferences. |
| 5. Confirmation of Price Movements | When used in conjunction with other technical analysis tools, the HLMA indicator can confirm the validity of price movements. It can validate trends identified by other indicators or chart patterns, increasing traders’ confidence in their trading decisions. |
Overall, the High Low Moving Average indicator is a valuable tool for traders, providing enhanced trend identification, reduced noise, early entry and exit signals, versatile application, and confirmation of price movements. By incorporating this indicator into their trading strategies, traders can gain an edge in the market and improve their trading results.
Read Also: Why Stock Options are a Better Investment: Benefits and Advantages
The High Low Moving Average (HLMA) indicator is a powerful tool for traders that can help identify trend reversals and potential trading opportunities. It is particularly useful for identifying support and resistance levels in the market.
When interpreting the HLMA indicator, it is important to understand that it is derived from the high and low prices of an asset over a specific period of time. The indicator calculates the moving average of the highest high and lowest low prices over a set number of periods and plots it on the chart.
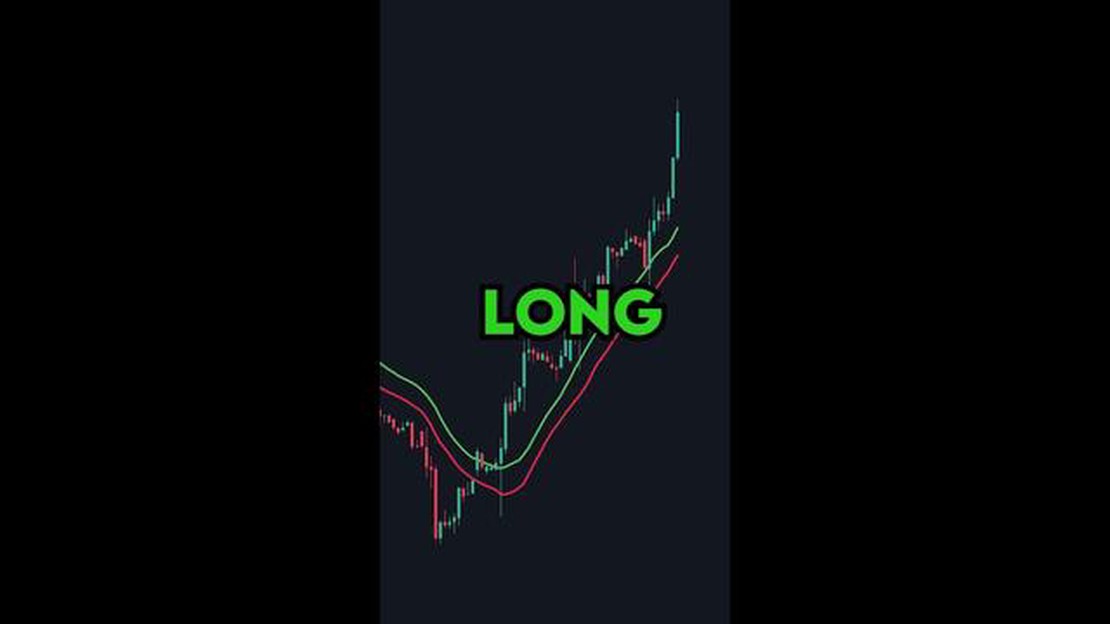
The HLMA indicator consists of a line that fluctuates above and below the price chart. When the HLMA line is above the price chart, it indicates a bullish trend, suggesting that prices are likely to continue rising. Conversely, when the HLMA line is below the price chart, it indicates a bearish trend, suggesting that prices are likely to continue falling.
Traders can use the HLMA indicator in multiple ways. One common strategy is to look for crossovers between the HLMA line and the price chart. When the HLMA line crosses above the price chart, it is considered a bullish signal, indicating that it may be a good time to buy. On the other hand, when the HLMA line crosses below the price chart, it is considered a bearish signal, indicating that it may be a good time to sell.
Another way to interpret the HLMA indicator is by looking at the distance between the HLMA line and the price chart. When the HLMA line is far above the price chart, it indicates that prices have moved significantly higher and may be due for a reversal. Conversely, when the HLMA line is far below the price chart, it indicates that prices have moved significantly lower and may be due for a reversal.

It is important to note that the HLMA indicator is not infallible and should be used in conjunction with other technical indicators and analysis tools. Traders should also consider other factors such as market conditions, news events, and risk management strategies when making trading decisions.
In summary, the High Low Moving Average indicator is a valuable tool for traders that can help identify trend reversals and potential trading opportunities. Traders can interpret the indicator by looking at the position of the HLMA line relative to the price chart and by observing crossovers and the distance between the HLMA line and the price chart.
The High Low Moving Average is an indicator that calculates the average of the highest high and lowest low over a given period of time. It is used to identify trends and potential reversals in the market.
The High Low Moving Average indicator works by taking the highest high and lowest low values over a specified period of time and calculating their average. This moving average is then plotted on a chart to provide visual representation of the trend.
The time frame you use for the High Low Moving Average indicator depends on your trading strategy and goals. Shorter time frames, such as 5 or 10 periods, can provide more frequent signals but may also generate more false signals. Longer time frames, such as 50 or 100 periods, can provide more reliable signals but may be slower to respond to market changes.
Yes, the High Low Moving Average indicator can be used for both bullish and bearish markets. It can help identify trends and potential reversals in either direction. In a bullish market, the indicator can be used to identify buying opportunities and confirm upward trends. In a bearish market, it can be used to identify selling opportunities and confirm downward trends.

Examples of Options Trading Options trading can be a complex and intimidating field to navigate, but with the right knowledge and strategies, it can …
Read Article
Understanding the Concept of 10 Pips on a Cent Account For forex traders, understanding the concept of pips is essential. A pip, short for “percentage …
Read Article
How much does Forex cost? Forex trading is a popular form of investment that allows individuals to trade currencies from around the world. However, …
Read Article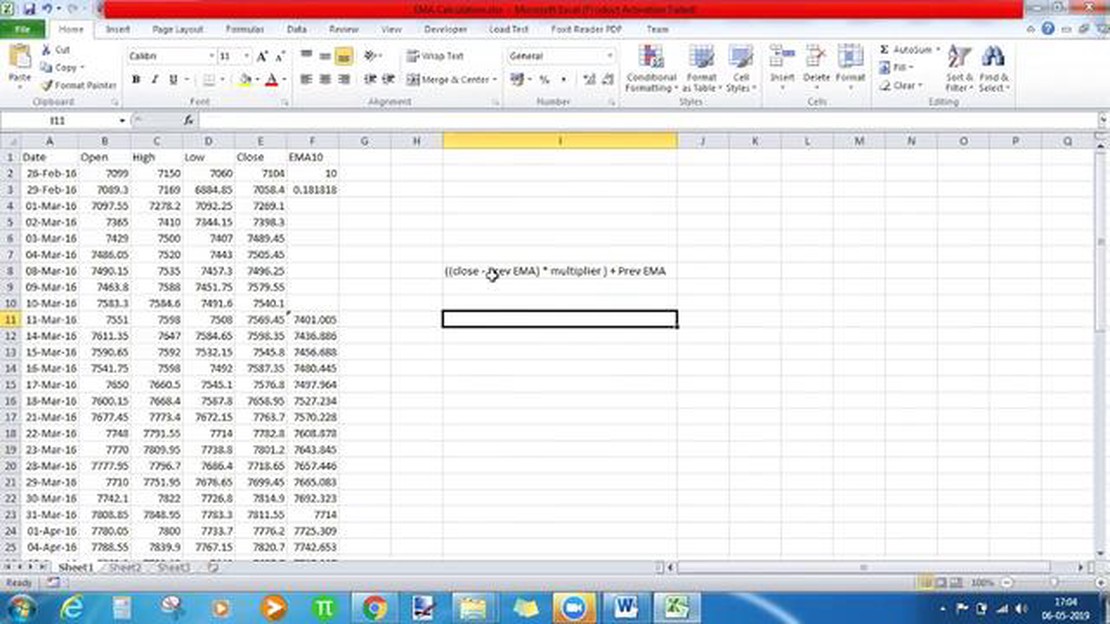
Calculating the 20-day Exponential Moving Average Calculating the 20-day Exponential Moving Average (EMA) is an important tool for traders and …
Read Article
Understanding Compensation Rates: When it comes to understanding compensation rates, there are a few key factors that every employee and employer …
Read Article
How to Locate Lost Stock Shares If you believe that you have lost track of your stock shares or maybe inherited shares from a relative but unable to …
Read Article


