


Understanding Restricted Stock Units at CVS: A Comprehensive Guide
Understanding Restricted Stock Units at CVS Restricted Stock Units (RSUs) are a common form of equity compensation offered to employees at CVS Health …
Read Article
When it comes to trading and investing in the financial markets, traders are always on the lookout for tools and techniques that can help them make better decisions and improve their chances of success. One such tool that has gained popularity among traders is the Fibonacci sequence and its related ratios.
The Fibonacci sequence is a mathematical pattern that was discovered by Leonardo Fibonacci, an Italian mathematician, in the 13th century. The sequence is created by adding the two previous numbers together to get the next number in the sequence. The sequence starts with 0 and 1, so the first few numbers in the sequence are 0, 1, 1, 2, 3, 5, 8, and so on.
The Fibonacci sequence is not only interesting mathematically, but it also has intriguing applications in trading. Traders use the Fibonacci ratios derived from the sequence to identify potential price levels, support and resistance zones, and market trends. These ratios, namely the 0.382, 0.500, and 0.618, are often applied to price retracements and extensions to help traders determine entry and exit points.
One of the reasons traders use Fibonacci is because these ratios are believed to reflect the natural order of market movements. The theory is that as traders react to price movements, they leave behind patterns that can be identified and predicted using Fibonacci levels. By applying these levels to charts, traders can gain insights into where prices might reverse or continue their movement.
Overall, Fibonacci levels provide traders with valuable information about potential support and resistance zones, which can help them make more informed trading decisions. While they are not foolproof, Fibonacci ratios have proven to be a useful tool for traders across various markets and timeframes, making them a popular choice among traders who are looking to gain an edge in their trading strategies.
Traders use Fibonacci analysis as a tool to predict potential price levels and market trends in financial markets. It is based on the Fibonacci sequence, a sequence of numbers in which each number is the sum of the two preceding ones: 0, 1, 1, 2, 3, 5, 8, 13, 21, and so on.
This sequence is closely related to the Golden Ratio, a mathematical concept that appears frequently in nature and has been found to have aesthetic appeal to humans. The Golden Ratio is approximately 1.618, and it is believed that certain price levels in financial markets exhibit a high degree of symmetry and harmony when they are related to each other by this ratio.
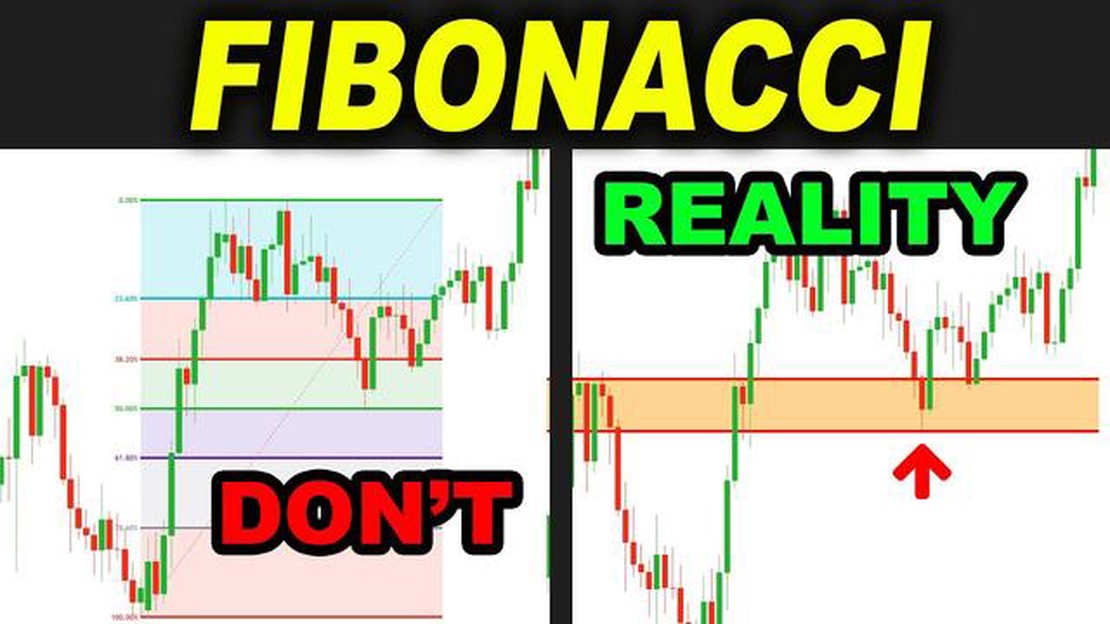
Traders use Fibonacci retracement and extension levels to identify potential support and resistance levels in a market. Fibonacci retracement levels are percentages derived from the Fibonacci sequence, such as 23.6%, 38.2%, 50%, 61.8%, and 78.6%. These levels are used to identify potential price reversals after a market has made a significant move.

Fibonacci extension levels, on the other hand, are used to identify potential price targets and areas where a market might find support or resistance after a breakout or a trend reversal. These levels are derived from ratios of the Fibonacci sequence, such as 161.8%, 261.8%, and 423.6%.
Traders use Fibonacci analysis as part of their technical analysis toolkit to identify potential entry and exit points for trades. By combining Fibonacci levels with other technical indicators and analysis techniques, traders can increase the probability of making profitable trades and reduce the risk of losses.
Read Also: Understanding the Key Differences between ACF and PACF
It is important to note that Fibonacci analysis is subjective and does not guarantee accurate predictions. However, many traders find it useful as a guideline for identifying potential price levels and market trends. It is always recommended to use Fibonacci analysis in conjunction with other types of analysis and to practice proper risk management when trading in financial markets.
The fibonacci sequence is a mathematical concept that can be used in various fields, including trading. Traders use fibonacci retracements and extensions to identify potential support and resistance levels in financial markets.
One of the main reasons why traders use fibonacci is its ability to predict price levels where buying or selling pressure may emerge. The fibonacci levels are derived from a series of numbers that follow a specific pattern.
The fibonacci sequence starts with the numbers 0 and 1, and each subsequent number in the sequence is the sum of the previous two numbers. The sequence goes as follows: 0, 1, 1, 2, 3, 5, 8, 13, 21, 34, and so on.
Traders apply fibonacci levels by measuring the distance between two significant price points, such as a swing high and a swing low. These levels are then used to anticipate potential areas of support or resistance.
For example, if a trader is analyzing an upward trend and identifies a swing low and a swing high, they can use fibonacci retracement levels to determine potential support levels where buyers might step in and push prices higher.
Read Also: Identifying the Most Profitable Algorithm in Forex: A Comprehensive Guide
Similarly, when analyzing a downward trend, fibonacci retracement levels can help identify potential resistance levels where sellers might enter the market and push prices lower.
In addition to retracement levels, traders also use fibonacci extensions to project potential price targets. These extensions are derived from fibonacci ratios and are used to identify areas where a trend might reverse or continue.

While fibonacci levels do not guarantee accurate predictions, they can provide traders with valuable information about possible turning points in the market. Many traders use fibonacci alongside other technical analysis tools to enhance their trading strategies.
The power of fibonacci lies in its versatility and its ability to capture the natural ebb and flow of price movements in financial markets. By understanding and applying fibonacci ratios, traders can gain a deeper insight into market dynamics and make more informed trading decisions.
Fibonacci is a mathematical sequence of numbers that traders use to identify potential levels of support and resistance in the financial markets. It is based on the theory that prices tend to retrace or reverse at certain levels that correspond to these Fibonacci ratios.
Fibonacci retracement levels are calculated by taking two extreme points on a chart and dividing the vertical distance by the key Fibonacci ratios of 23.6%, 38.2%, 50%, 61.8%, and 100%. These levels are then used to identify potential areas of support or resistance.
Traders use Fibonacci retracement levels to help identify potential areas of support and resistance in the markets. These levels can act as price targets or areas where traders might consider entering or exiting positions. By combining Fibonacci levels with other technical analysis tools, traders can enhance their trading strategies.
Fibonacci retracements are not always 100% accurate, as no technical analysis tool can guarantee precise price predictions. However, Fibonacci levels are widely used by traders because they have proven to be effective in many cases. Traders often combine Fibonacci retracements with other indicators or price patterns to increase the accuracy of their analysis and improve their trading decisions.

Understanding Restricted Stock Units at CVS Restricted Stock Units (RSUs) are a common form of equity compensation offered to employees at CVS Health …
Read Article
Canada Balikbayan Box Size: Everything You Need to Know If you are sending a balikbayan box from Canada to your loved ones in the Philippines, it’s …
Read Article
Holding Period for Stock Options: Explained and Analyzed When it comes to investing in stock options, understanding the holding period is crucial. The …
Read Article
Understanding the Meaning of CPC in Banking When it comes to banking, it’s important to understand the different terms and acronyms that are commonly …
Read Article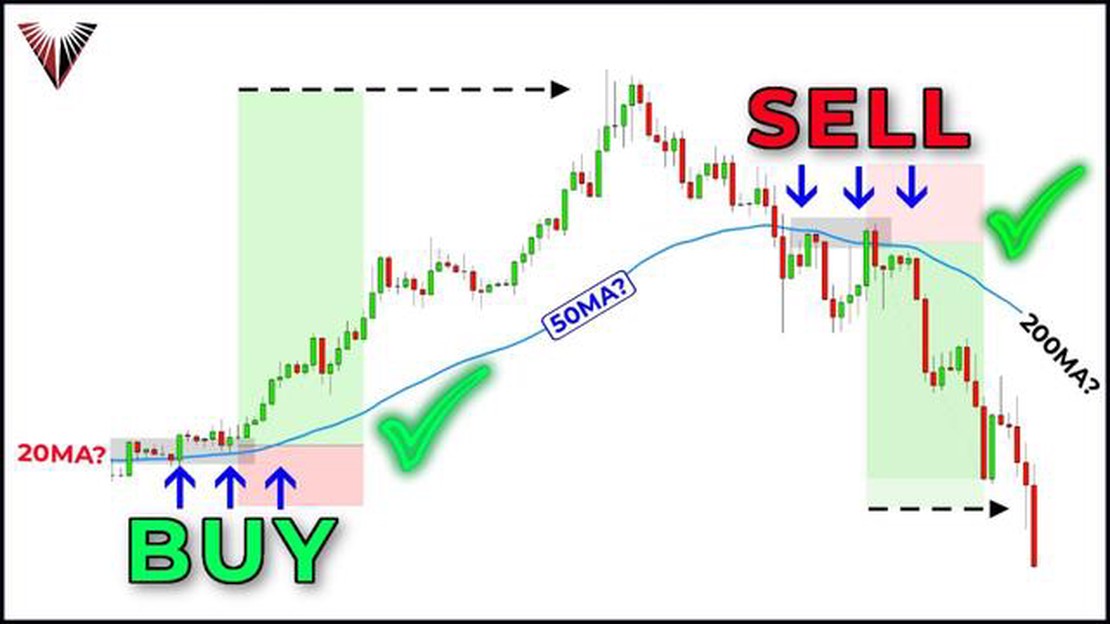
Understanding EMA Forex: A Comprehensive Guide When it comes to forex trading, technical analysis is an essential tool for making informed decisions. …
Read Article
EWMA Control Chart: Applications and Uses The Exponentially Weighted Moving Average (EWMA) control chart is a statistical tool used to monitor …
Read Article


