


Best FX Brokers in Nigeria: Top Choices and Expert Reviews
Best FX Broker in Nigeria: Find the Top Brokerage for Forex Trading in Nigeria When it comes to forex trading, having the right broker is essential …
Read Article
The 50-day and 200-day moving averages (DMA) are important technical indicators used in financial markets to analyze price trends. These moving averages help traders and investors identify potential long-term and short-term price trends, as well as support and resistance levels.
The 50-day DMA is calculated by taking the average closing price of a security over the past 50 trading days, while the 200-day DMA is calculated by taking the average closing price over the past 200 trading days. Moving averages are commonly used in technical analysis to smooth out price fluctuations and provide a clearer picture of the overall trend.
The 50-day DMA is considered a short-term indicator, providing traders and investors with insights into short-term price movements. It is often used by active traders to determine entry and exit points for short-term trades. If the current price is above the 50-day DMA, it is seen as a bullish signal, indicating potential upward momentum. Conversely, if the price is below the 50-day DMA, it is seen as a bearish signal, suggesting potential downward momentum.
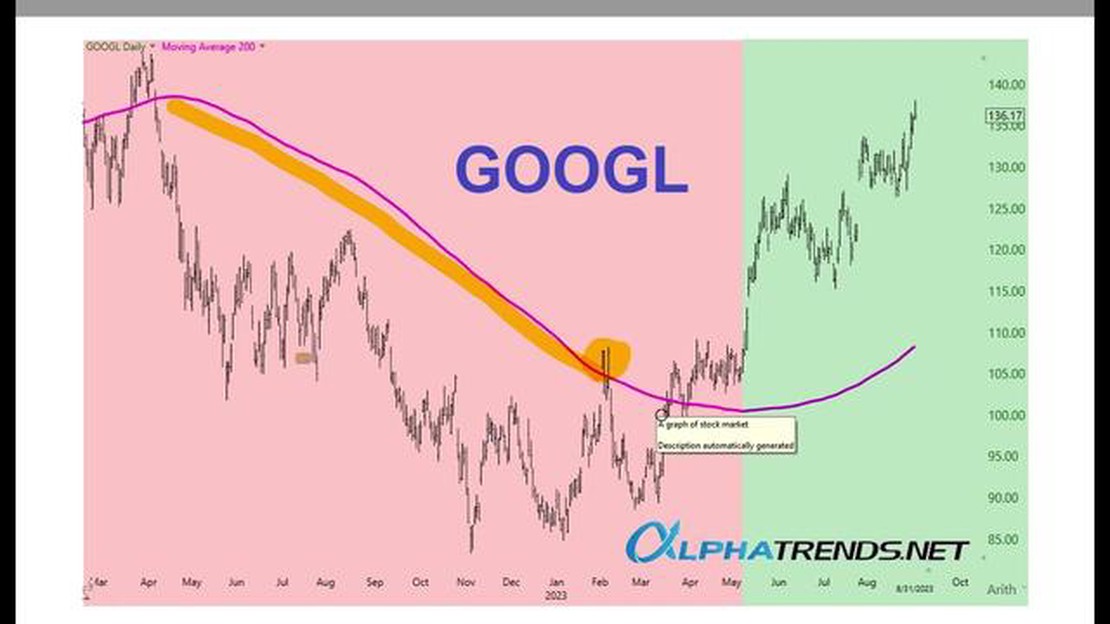
The 200-day DMA is considered a long-term indicator, providing traders and investors with insights into long-term price trends. It is often used by long-term investors to determine the overall health of a stock or market. If the current price is above the 200-day DMA, it is seen as a bullish signal, indicating a potential uptrend. On the other hand, if the price is below the 200-day DMA, it is seen as a bearish signal, indicating a potential downtrend.
Understanding the 50 and 200-day moving averages can help traders and investors make more informed decisions when buying or selling securities. By analyzing the relationship between the current price and these moving averages, market participants can gain insights into potential trend reversals, as well as support and resistance levels. However, it is important to use these indicators in conjunction with other technical analysis tools and fundamental analysis to minimize risks and maximize potential returns.
A moving average is a commonly used technical analysis tool that helps investors and traders identify trends in the price of a security or other financial instrument. It is calculated by taking the average price of a security over a specific period of time, such as the last 50 or 200 trading days.

The moving average is used to smooth out price fluctuations and provide a clearer picture of the overall trend. By averaging the price over a specific period of time, it filters out short-term noise and highlights the longer-term price direction.
There are two main types of moving averages: the simple moving average (SMA) and the exponential moving average (EMA). The SMA calculates the average price over a given period by simply adding up the prices and dividing by the number of periods. The EMA, on the other hand, gives more weight to recent prices, making it more responsive to changes in price.
Moving averages are often used in combination with other technical indicators to make investment decisions. For example, traders may use a crossover strategy where they buy a security when its short-term moving average crosses above its long-term moving average, indicating a bullish trend, and sell when the opposite occurs.
Overall, moving averages are a valuable tool for investors and traders to analyze price trends and make informed decisions about buying and selling securities.
When it comes to technical analysis, one of the most commonly used tools is the moving average. Moving averages are used to analyze past price data and identify trends and patterns. They are calculated by taking the average price of a security over a specific period of time, and then plotting it on a chart.
Read Also: Calculating the Exponential Moving Average of Infosys: All You Need to Know
The moving average is called “moving” because it is constantly updated as new data is available. This makes it a powerful tool for trend analysis, as it smooths out the noise in the price data and helps to identify the underlying trend.
There are different types of moving averages that traders use, but the most commonly used ones are the 50-day and 200-day moving averages. The 50-day moving average is used to identify short-term trends, while the 200-day moving average is used to identify long-term trends.
Read Also: ABCD Pattern in Tradingview: An In-depth Analysis and Guide
Traders typically look for a crossover between the 50-day and 200-day moving averages as a signal that a trend reversal may be imminent. If the 50-day moving average crosses above the 200-day moving average, it is seen as a bullish signal, indicating that the price is likely to continue rising. On the other hand, if the 50-day moving average crosses below the 200-day moving average, it is seen as a bearish signal, indicating that the price is likely to continue falling.
| Date | Price | 50-day Moving Average | 200-day Moving Average |
|---|---|---|---|
| Jan 1, 2020 | 100 | - | - |
| Jan 2, 2020 | 105 | - | - |
| Jan 3, 2020 | 110 | - | - |
| Jan 4, 2020 | 115 | - | - |
In the example table above, the 50-day and 200-day moving averages have been left blank for illustrative purposes. However, in a real-world scenario, these values would be calculated based on historical price data.
By analyzing the moving averages, traders can gain insights into the overall trend of a security and make informed trading decisions. They can use the moving averages to confirm the validity of a trend, identify potential trend reversals, and determine entry and exit points for their trades.
It is important to note that moving averages are lagging indicators, meaning that they are based on past price data and may not accurately predict future price movements. Therefore, it is always recommended to use moving averages in conjunction with other technical analysis tools and indicators.

The 50 and 200 day moving averages are technical indicators used in stock market analysis. The 50 day moving average is the average price of a stock over the past 50 days, while the 200 day moving average is the average price over the past 200 days. These averages are used to identify trends and determine potential buy or sell signals.
The 50 and 200 day moving averages are calculated by summing up the closing prices of a stock over the specified number of days and then dividing the sum by the number of days. For example, to calculate the 50 day moving average, you would add up the closing prices of a stock for the past 50 days and divide the sum by 50.
The 50 and 200 day moving averages are significant because they help traders and investors determine the overall trend of a stock. When the price of a stock is above the moving average, it suggests a bullish trend, while a price below the moving average suggests a bearish trend. Additionally, the crossover of the 50 and 200 day moving averages can signal a potential change in trend.
The 50 and 200 day moving averages can be used for any stock, but their effectiveness may vary depending on the stock’s volatility and trading volume. Stocks with high volatility and trading volume tend to have more reliable moving average signals, while stocks with low volatility and trading volume may produce less accurate signals. It’s important to consider other factors and indicators when using moving averages to make trading decisions.

Best FX Broker in Nigeria: Find the Top Brokerage for Forex Trading in Nigeria When it comes to forex trading, having the right broker is essential …
Read Article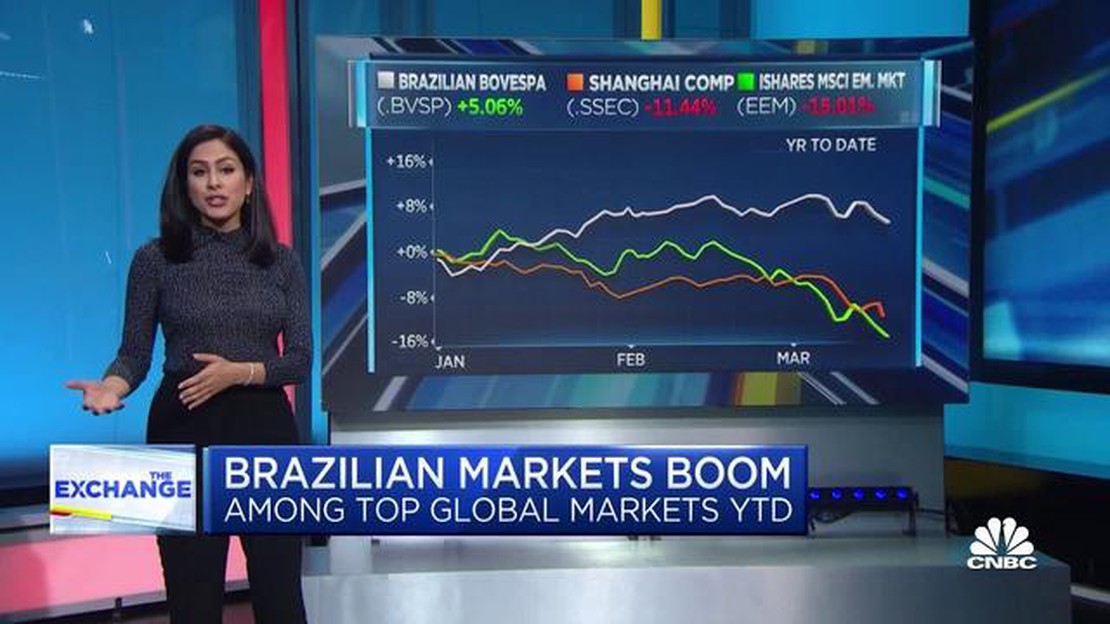
Is there a stock market in Brazil? Brazil is not only famous for its beautiful beaches, vibrant culture, and passionate football fans, but also for …
Read Article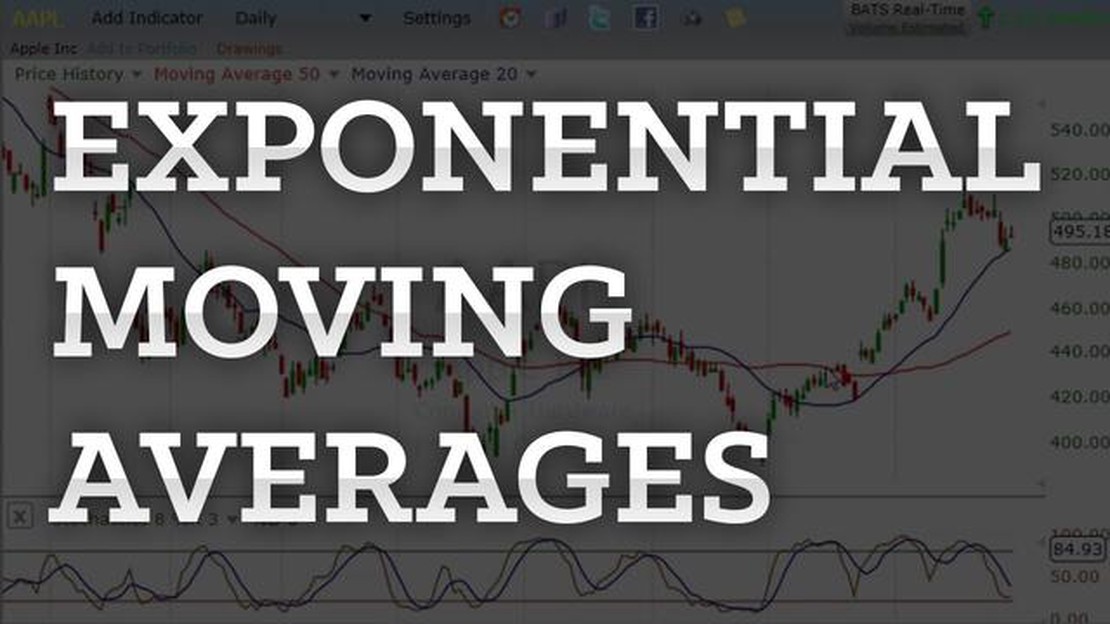
Understanding Exponential Moving Averages: A Comprehensive Guide An exponential moving average (EMA) is a popular tool used in technical analysis to …
Read Article
Are limit orders displayed in dark pools? Dark pools have become an increasingly popular way for institutional investors to execute large trades away …
Read Article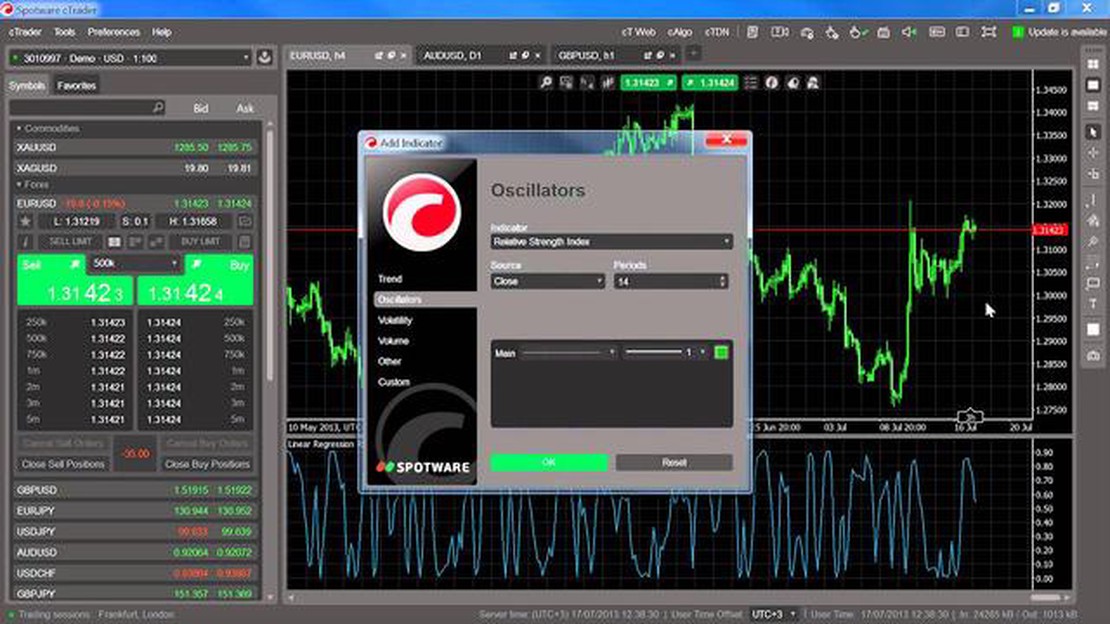
Understanding the R-squared Indicator in MT4 When it comes to analyzing financial markets, traders often rely on various technical indicators to make …
Read Article
Understanding the Concept of Trading Strategy Trading in the financial markets can be a highly lucrative venture, but it also comes with its fair …
Read Article

