


Understanding Binary Genetic Algorithm: A Comprehensive Guide
Understanding the Binary Genetic Algorithm Genetic algorithms (GAs) are powerful search and optimization techniques inspired by the process of natural …
Read Article
The ABCD pattern is a popular trading pattern used by technical analysts to identify potential trend reversals and continuation opportunities in financial markets. This pattern is based on the idea that markets tend to move in a series of impulsive and corrective waves, creating repetitive patterns that can be profitably exploited by traders.
In this comprehensive analysis and guide, we will explore the key characteristics and components of the ABCD pattern, as well as how to identify and trade it effectively using the Tradingview platform.
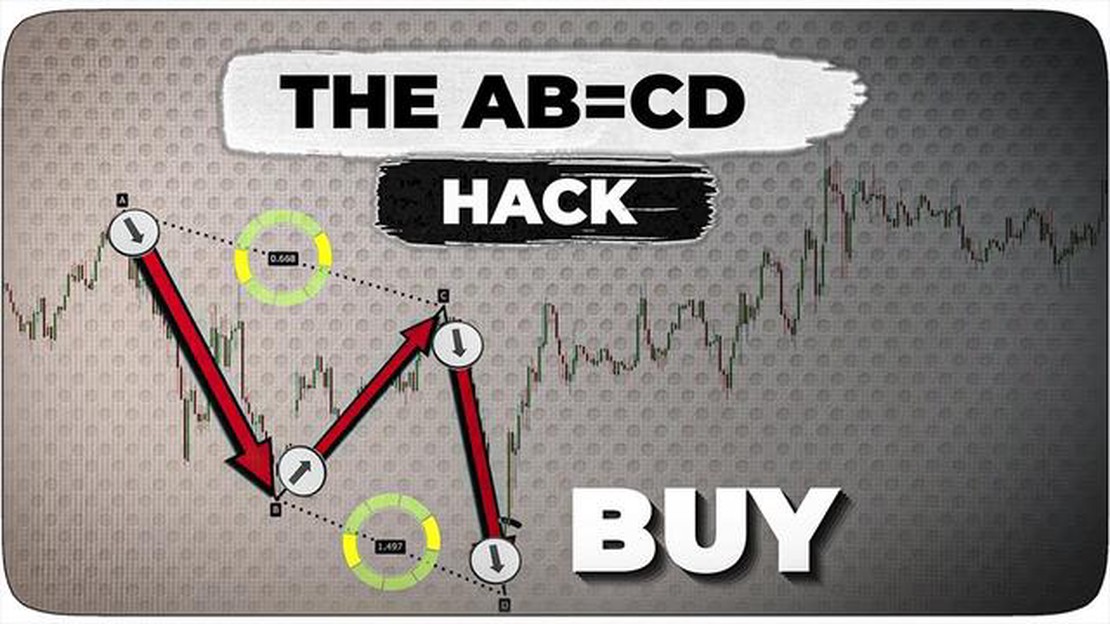
The ABCD pattern is composed of four distinct legs, labeled as A, B, C, and D. Each leg represents a specific price movement that is either ascending or descending, and the pattern is formed when these legs align in a specific geometric structure.
Traders can use various technical indicators and tools to identify and confirm the validity of an ABCD pattern, such as Fibonacci retracements, trend lines, and moving averages. By understanding the structure and characteristics of this pattern, traders can anticipate future price movements and make informed trading decisions.
In this guide, we will delve into the intricacies of trading the ABCD pattern, including entry and exit strategies, risk management techniques, and real-life trading examples. By mastering this pattern, traders can enhance their profitability and consistency in the financial markets.
“The ABCD pattern is a powerful tool in the arsenal of technical analysts, allowing them to spot potential reversals and continuation patterns with a high degree of accuracy. By effectively applying this pattern in their trading strategies, traders can gain a significant edge in the markets and increase their chances of success.”
The ABCD pattern is a popular technical analysis pattern used by traders to identify potential reversals or continuations in price trends. It is named after the sequential letters of the pattern: A, B, C, and D.
The pattern consists of four key points:

Traders use the ABCD pattern to anticipate potential price reversals or continuations at point D. They look for other technical indicators or chart patterns to confirm the validity of the pattern.
When trading the ABCD pattern, traders typically look for potential entry points near point D and set stop-loss orders below point C. They also set profit targets based on Fibonacci extensions or previous price levels.
Read Also: Where to exchange currency for US dollars in Nagpur: top tips and recommendations
It is important to note that the ABCD pattern is just one tool in a trader’s arsenal and should be used in conjunction with other technical analysis methods for better accuracy. Traders should also consider the overall market conditions and any fundamental factors that may influence price movements.
Overall, understanding and recognizing the ABCD pattern in Tradingview can be a valuable skill for traders looking to identify potential trading opportunities and manage their risk effectively.
At its core, the ABCD pattern is based on the concept of Fibonacci ratios and the idea that price movements tend to follow a specific structure. The pattern is named after the sequence of ratios between the lengths of the AB and CD legs, which are typically 0.618 and 1.272 or 1.618 of the length of the BC leg, respectively.
Traders use the ABCD pattern to anticipate potential trend reversals and trade profitably. The pattern can be identified by connecting points A and B to form the AB leg, retracing the AB leg with the BC leg, and finally projecting the BC leg to estimate the potential price target of the CD leg.
Furthermore, traders often combine the ABCD pattern with other technical analysis tools, such as trendlines, moving averages, and Fibonacci retracement levels, to increase the probability of a successful trade. By identifying the ABCD pattern and confirming it with other indicators, traders can make more informed trading decisions.
It’s important to note that the ABCD pattern is not foolproof and should be used in conjunction with other analysis techniques to assess the overall market context. Traders should also consider risk management strategies, such as using stop-loss orders, to protect their capital in case the pattern fails to materialize.
In conclusion, the ABCD pattern is a powerful tool for identifying potential trend reversals and trade opportunities. By understanding the structure and principles behind the pattern, traders can effectively incorporate it into their trading strategies and improve their chances of success in the financial markets.
The ABCD pattern is a popular technical analysis tool used by traders to identify potential price reversals. It consists of four price swings and forms a distinct structure on a price chart. Understanding the key characteristics of the ABCD pattern is essential for accurately identifying and trading this pattern.
Read Also: How Much Does a Trading Computer Cost? Find Out Here
The ABCD pattern is named after the four points that make up its structure: point A, point B, point C, and point D. Each point represents a specific price level and time period. Point A marks the start of the pattern, point B indicates the first significant price swing, point C represents a pullback or correction from point B, and point D is the completion of the pattern.
The key characteristics of the ABCD pattern include:

| Characteristic | Description |
|---|---|
| Symmetry | The price swings AB and CD should have a similar length and duration, creating a symmetrical pattern. |
| Ratio | The distance AB should be approximately 61.8% of the distance BC, and CD should be approximately 161.8% of BC. This ratio is derived from the Fibonacci sequence and is important for confirming the validity of the pattern. |
| Confluence | The ABCD pattern should align with other technical analysis tools, such as support or resistance levels, trendlines, or Fibonacci retracement levels. This confluence increases the likelihood of a successful trade. |
| Timeframe | The ABCD pattern can form on any timeframe, from intraday charts to weekly or monthly charts. Traders should consider the timeframe they are trading and adjust their strategies accordingly. |
Trading strategies for the ABCD pattern vary depending on a trader’s risk tolerance and trading style. Some common strategies include:
Overall, the ABCD pattern is a versatile and reliable tool for identifying potential price reversals. By understanding its key characteristics and implementing effective trading strategies, traders can increase their chances of success in the financial markets.
An ABCD pattern is a specific chart pattern that traders use to identify potential reversals or continuation trends in the market. It consists of four points: A, B, C, and D.
To identify an ABCD pattern, traders look for specific price movements. Point A represents the start of the pattern, point B is a retracement from point A, point C is an extension from point B, and point D is the completion of the pattern, usually at Fibonacci levels.
Fibonacci levels play a crucial role in ABCD patterns as they help traders determine the potential reversal or continuation levels. The most common Fibonacci levels used are 38.2%, 50%, and 61.8%. Traders look for confluence between these levels and other technical indicators to confirm their trading decisions.
While ABCD patterns can be a useful tool in technical analysis, they are not foolproof. Traders should always use them in conjunction with other indicators and signals to confirm their trading decisions. It’s essential to practice proper risk management and use stop-loss orders to mitigate potential losses.

Understanding the Binary Genetic Algorithm Genetic algorithms (GAs) are powerful search and optimization techniques inspired by the process of natural …
Read Article
What are the charges on foreign transactions in Axis Bank? When it comes to making international transactions, it’s important to understand the fees …
Read Article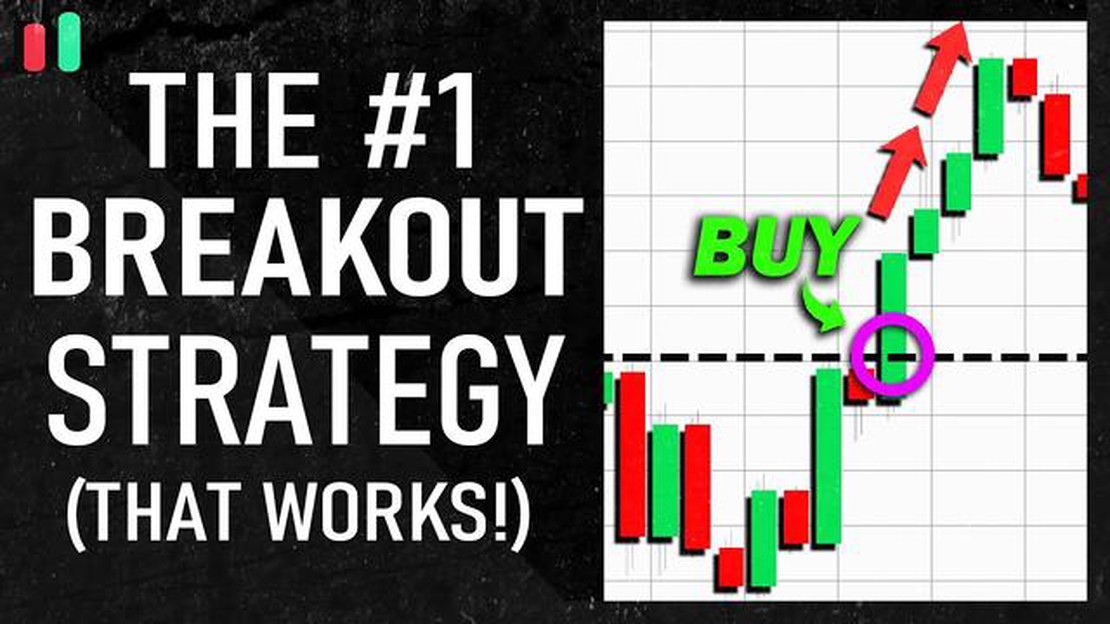
What is the Best Breakout Strategy? Discover the Most Effective Breakout Strategy for Maximum Profits Table Of Contents Learn the Best Breakout …
Read Article
Should I Follow Forex Signals? Forex trading has become increasingly popular in recent years as individuals look for ways to make money from home. One …
Read Article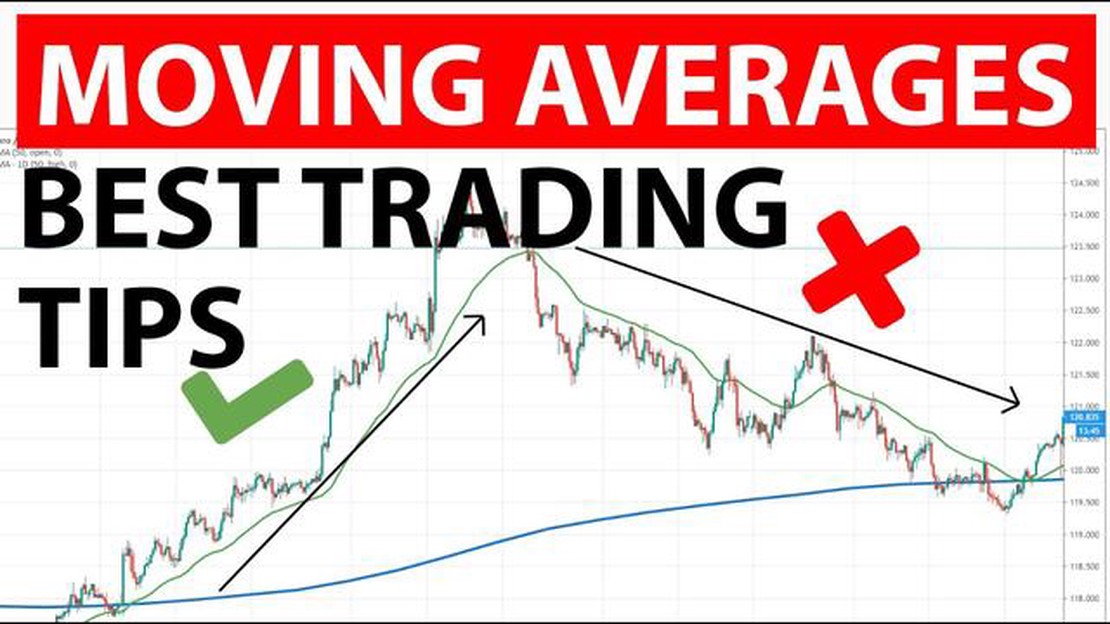
Which is better for swing trading: SMA or EMA? When it comes to swing trading, one of the key tools traders use is moving averages. Moving averages …
Read Article
How much can a trading robot make? Trading robots, also known as algorithmic trading systems or simply algos, have gained popularity in the financial …
Read Article


