


Step-by-Step Guide: How to Start Trading Forex Successfully
Beginner’s Guide: How to Start Trading Forex Forex trading has become increasingly popular in recent years, offering individuals the opportunity to …
Read Article
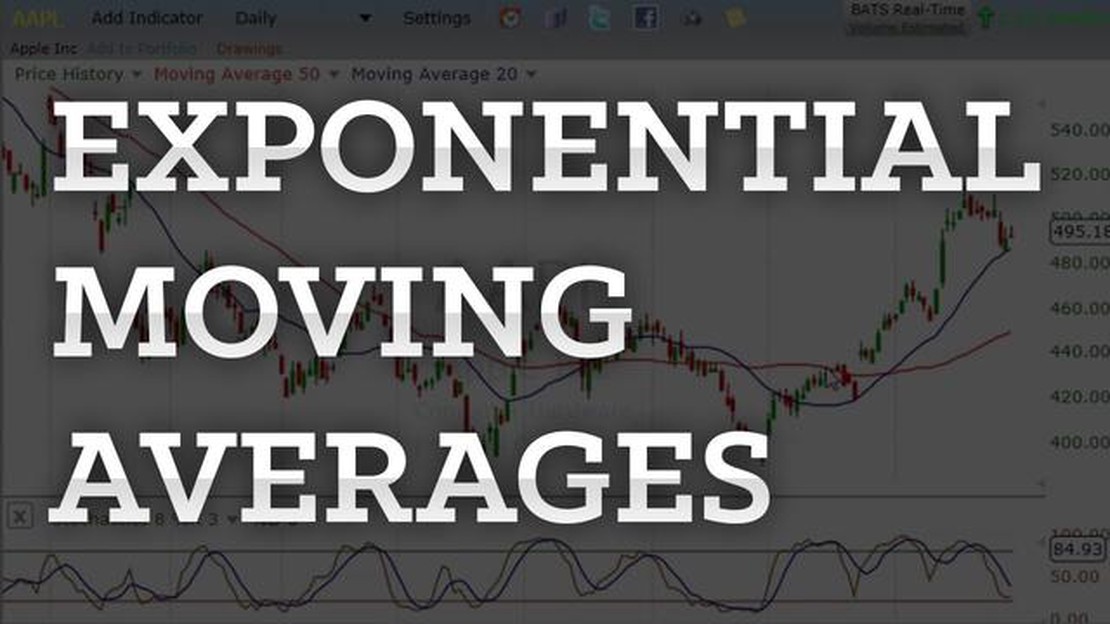
An exponential moving average (EMA) is a popular tool used in technical analysis to identify trends and make predictions about future price movements in financial markets. Unlike a simple moving average, which gives equal weight to all data points, an EMA assigns more weight to recent data points, making it a more responsive indicator.
To interpret EMA, it is important to understand the concept of trend. A rising EMA indicates an uptrend, suggesting that the price is likely to continue moving higher. Conversely, a falling EMA suggests a downtrend, indicating that the price is likely to continue moving lower. Traders often use the crossover of different EMAs to identify potential entry and exit points.
Another important aspect of interpreting EMA is to look for support or resistance levels. When the price approaches or crosses above an EMA, it can act as a support level, indicating that the price is likely to bounce back. On the other hand, when the price approaches or crosses below an EMA, it can act as a resistance level, suggesting that the price is likely to face selling pressure and struggle to move higher.
It is important to note that while EMAs are effective tools for identifying trends and potential trading opportunities, they should be used in conjunction with other technical indicators and analysis methods to confirm signals and reduce the risk of false signals.
In conclusion, interpreting exponential moving averages involves analyzing trends, identifying potential entry and exit points, and looking for support or resistance levels. By understanding how EMAs work and combining them with other technical indicators, traders can gain valuable insights and make more informed trading decisions.
Exponential moving averages (EMAs) are a type of technical indicator commonly used in financial analysis to identify trends and make predictions about future price movements. Unlike simple moving averages (SMAs), EMAs place greater weight on recent data points, making them more responsive to price changes.

The concept behind EMAs is based on the idea that recent prices are more relevant in determining future price trends than older prices. By giving more weight to recent price data, EMAs aim to provide a more accurate representation of the current market conditions and enable traders to react more quickly to changes.
Calculating an exponential moving average involves multiplying the previous EMA value by a smoothing factor (typically between 0 and 1) and adding the current price multiplied by the complement of the smoothing factor. The smoothing factor determines the rate at which old prices are discounted and new prices are incorporated into the average.
The smoothing factor can be adjusted to suit different trading strategies or timeframes. A smaller smoothing factor will place more weight on recent data, resulting in a more responsive EMA that quickly adapts to price changes. On the other hand, a larger smoothing factor will give more weight to older data, resulting in a smoother EMA that is slower to react to price fluctuations.
EMAs can be calculated using various time periods, depending on the trader’s preference. Short-term EMAs, such as a 9-day or 12-day EMA, are commonly used for identifying short-term trends or making quick trading decisions. Longer-term EMAs, such as a 50-day or 200-day EMA, are often used for identifying longer-term trends or providing a broader perspective on price movements.
Read Also: Is trading options difficult? Discover the truth about trading options
Traders often use EMAs in conjunction with other technical indicators to confirm trading signals or generate buy/sell signals. For example, when the price crosses above the EMA, it may signal a bullish trend, while a cross below the EMA may indicate a bearish trend. Additionally, the slope of the EMA can provide insights into the strength and direction of the trend.
It’s important to note that EMAs are not perfect indicators and should be used in conjunction with other forms of analysis and risk management tools. Traders should consider other factors such as volume, support and resistance levels, and market sentiment before making trading decisions based solely on EMAs.
Read Also: What Makes an Elite Trader? Secrets of Successful Traders Revealed
In summary, exponential moving averages are a powerful tool in technical analysis that can help traders identify trends, make predictions, and generate trading signals. By giving more weight to recent data, EMAs provide a more responsive and accurate representation of the current market conditions. However, they should be used in conjunction with other indicators and analysis techniques to make informed trading decisions.
Exponential moving averages (EMAs) are widely used in technical analysis to identify trends in financial markets. This moving average calculation places more weight on recent prices, making it more responsive to short-term price movements compared to simple moving averages.
When interpreting exponential moving averages for trend analysis, several key factors should be considered:
| EMA Period | The period or length of the EMA determines the number of data points used in the calculation. Shorter periods, such as 10 or 20, are more sensitive to recent price changes and can help identify shorter-term trends. Conversely, longer periods, such as 50 or 200, provide a smoother line and are often used to identify longer-term trends. |
| Crossover | EMA crossovers are a common signal used to determine trend reversals. When a shorter-term EMA crosses above a longer-term EMA, it is considered a bullish signal, indicating a potential uptrend. Conversely, when a shorter-term EMA crosses below a longer-term EMA, it is considered a bearish signal, suggesting a potential downtrend. |
| Slope | The slope of the EMA can provide valuable insights into the strength of a trend. A steep upward slope indicates a strong bullish trend, while a steep downward slope suggests a strong bearish trend. A flat or gradually sloping EMA may indicate a range-bound market or a weakening trend. |
| Support and Resistance | EMA lines can act as support or resistance levels, where prices often bounce off or struggle to break through. Traders often look for price rejections or breakouts at these levels as potential entry or exit points. |
| Divergence | Divergence occurs when the price of an asset is moving in the opposite direction of the EMA. This can be a warning sign of a potential trend reversal. Bullish divergence occurs when the price makes lower lows, but the EMA makes higher lows. Bearish divergence occurs when the price makes higher highs, but the EMA makes lower highs. |

By considering these factors and analyzing various timeframes, traders can better interpret exponential moving averages and make informed decisions regarding trend analysis.
An exponential moving average (EMA) is a type of moving average that gives more weight to recent data points. It is calculated by taking the average of a specific number of data points, with more weight given to the most recent data points.
The exponential moving average is calculated using a formula that assigns weights to each data point based on its position in the time series. The formula is: EMA = (Close - EMA(previous day)) * (2 / (length + 1)) + EMA(previous day). The length refers to the number of data points included in the calculation.
The exponential moving average is commonly used in technical analysis to identify trends and determine potential entry and exit points in the market. It is believed to give more weight to recent price data, making it more responsive to short-term price changes.
The exponential moving average can be interpreted in different ways. When the price is above the EMA, it may indicate an uptrend, while when the price is below the EMA, it may indicate a downtrend. The EMA can also be used as a support or resistance level, with the price bouncing off of it. Additionally, when the EMA turns upward after a period of decline or vice versa, it may signal a change in trend.

Beginner’s Guide: How to Start Trading Forex Forex trading has become increasingly popular in recent years, offering individuals the opportunity to …
Read Article
Why is it called vanilla option? An option is a financial instrument that gives the buyer the right, but not the obligation, to buy or sell an …
Read Article
Where can I buy Yen in SM? When traveling to Japan, one of the first things that needs to be considered is how to obtain the local currency, the Yen …
Read Article
What is the future of the GBP? The British Pound (GBP) has long been a symbol of economic stability and strength. As one of the oldest currencies in …
Read Article
How to Calculate Movement Inventory Understanding and managing inventory movement is a critical aspect of a successful business. Accurately …
Read Article
Is AvaTrade trustworthy? When it comes to choosing a trading platform, reliability and reputation are two crucial factors to consider. AvaTrade is a …
Read Article


