
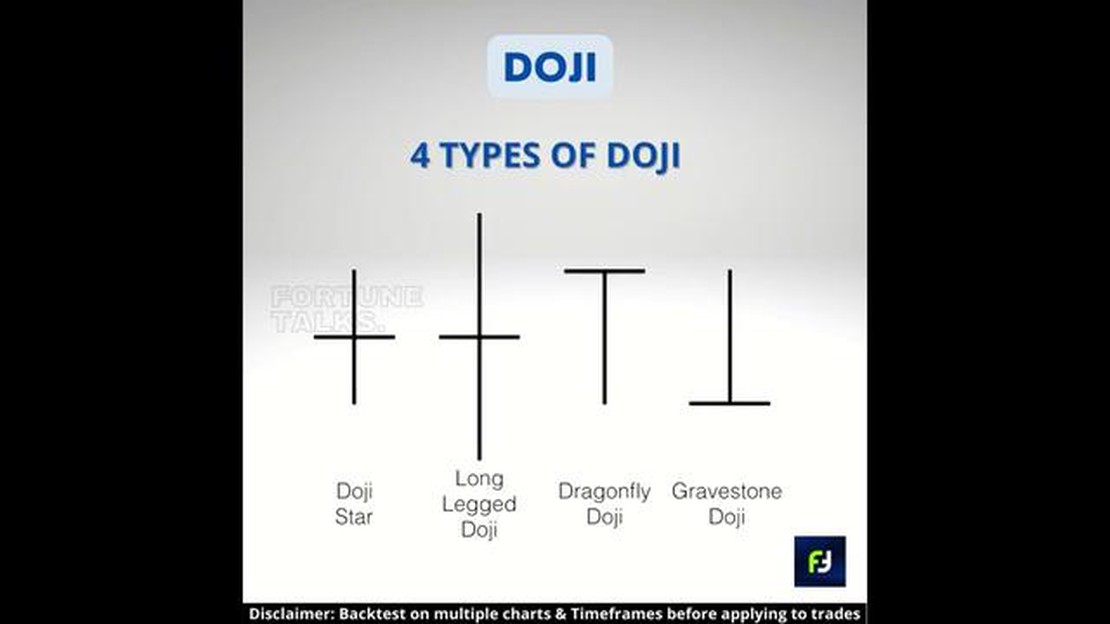

Understanding the Distinction between Doji and Evening Star Patterns
Understanding the Difference Between Doji and Evening Star Candlestick Patterns In the world of technical analysis, traders rely on various chart …
Read Article
When it comes to trading USDINR (US dollar to Indian rupee), using indicators can significantly improve your chances of making successful trades. Indicators are powerful tools that help traders analyze market trends, identify potential entry or exit points, and make informed trading decisions. In this article, we will discuss some of the top indicators for USDINR trading and help you find the best indicator for your trading strategy.
One of the most commonly used indicators for USDINR trading is the Moving Average (MA). Moving averages provide a smooth line that represents average price over a specified time period. They can help traders identify the direction of the market trend and determine potential support and resistance levels. Using different time periods for moving averages, such as the 50-day and 200-day moving averages, can provide valuable insights into long-term market trends.
Another popular indicator for USDINR trading is the Relative Strength Index (RSI). The RSI is a momentum oscillator that measures the speed and change of price movements. It helps traders identify overbought and oversold conditions in the market, which can signal potential reversals or trend continuations. By combining RSI readings with other indicators or chart patterns, traders can make more accurate predictions of future price movements.
The Bollinger Bands indicator is also widely used by USDINR traders. Bollinger Bands consist of a middle band, which is a simple moving average, and two outer bands that are standard deviations away from the middle band. These bands expand and contract based on market volatility. When the price reaches the upper band, it may be overbought, and when it reaches the lower band, it may be oversold. Traders can use Bollinger Bands to identify potential price reversals or trend continuations.
It is important to note that no single indicator can guarantee successful trades. It is often beneficial to use a combination of indicators and analyze other factors, such as market news and economic data, to make well-informed trading decisions. Additionally, it is essential to practice risk management and follow a disciplined trading strategy to minimize losses and maximize profits. Remember, successful trading requires continuous learning, adaptation, and practice.
In conclusion, using indicators can greatly improve your USDINR trading strategy. Moving averages, RSI, and Bollinger Bands are just a few of the many indicators available to traders. Experiment with different indicators and find the ones that work best for you. Remember to always analyze the market and use risk management techniques to ensure successful and profitable trades.
When it comes to trading in the USD/INR currency pair, using the right indicators can greatly increase your chances of making successful trades. These indicators can help you identify potential trends, predict market movements, and make informed trading decisions. Here are some of the top indicators for USD/INR trading:

1. Moving Averages: Moving averages are one of the most commonly used indicators in forex trading. They help smoothen out price fluctuations and provide a clearer picture of the market trend. By calculating the average price over a specific period, moving averages can help you identify the direction of the market and potential support and resistance levels.
2. Relative Strength Index (RSI): The RSI is a momentum oscillator that measures the speed and change of price movements. It is a valuable tool for identifying overbought and oversold conditions in the market. When the RSI reaches certain levels, it can signal a potential reversal in the market trend, allowing traders to take advantage of upcoming price movements.
3. Bollinger Bands: Bollinger Bands consist of a middle band and two outer bands that are plotted above and below the price chart. The middle band is usually a moving average, while the outer bands are calculated based on standard deviations from the moving average. Bollinger Bands help traders identify periods of high and low volatility, as well as potential trend reversals.
4. Fibonacci Retracement: Fibonacci retracement levels are a popular tool for identifying potential support and resistance levels in the market. These levels are based on the Fibonacci sequence and are used by traders to determine areas where the price is likely to reverse or continue its trend. By plotting these levels on the price chart, traders can anticipate possible entry and exit points.
5. MACD (Moving Average Convergence Divergence): MACD is a commonly used indicator that combines moving averages and momentum. It consists of two lines – the MACD line and the signal line. When the MACD line crosses above or below the signal line, it generates buy or sell signals. MACD can help traders identify the strength and direction of a trend, as well as potential trend reversals.
Read Also: Beginner's Guide: How to Use EMA in Forex Trading
These are just a few of the many indicators available for USD/INR trading. It’s important to remember that no single indicator can guarantee success in trading, as the forex market is influenced by various factors. It’s advisable to use a combination of indicators and also consider other factors such as fundamental analysis, market news, and risk management strategies to make well-informed trading decisions.
Choosing the right indicator is crucial for successful trading in the USDINR market. With so many indicators available, it can be challenging to determine which one to use. However, by understanding the purpose and characteristics of each indicator, traders can make an informed decision about which indicator suits their trading style and strategy.
One popular indicator for USDINR trading is the Moving Average (MA). This indicator helps traders identify trends and potential trend reversals. By calculating the average price over a specified period, the MA smooths out price fluctuations and provides a clear indication of the market direction. Traders can use different moving average periods to fit their timeframes and trading goals.
Another commonly used indicator is the Relative Strength Index (RSI). This oscillator measures the speed and change of price movements. By indicating whether the market is overbought or oversold, the RSI helps traders identify potential entry and exit points. Traders can use the RSI in conjunction with other indicators to confirm signals and increase the accuracy of their trades.
Read Also: How to Add EMA to RSI Indicator: A Step-by-Step Guide
The Bollinger Bands indicator is also popular in USDINR trading. This indicator consists of three lines: a moving average line, an upper band, and a lower band. The bands indicate the volatility of the market, with narrower bands indicating lower volatility and wider bands indicating higher volatility. Traders can use the Bollinger Bands to identify potential breakouts or reversals when the price moves outside of the bands.
Additionally, the Moving Average Convergence Divergence (MACD) indicator is widely used by traders. This indicator combines two moving averages to generate trading signals. The MACD line represents the difference between the shorter and longer moving averages, while the signal line is a moving average of the MACD line. Traders look for crossovers and divergences between these lines to identify potential buy or sell signals.
Traders should note that no single indicator guarantees success in trading. It is essential to understand the strengths and limitations of each indicator and use them in conjunction with other tools and strategies. Additionally, traders should consider market conditions and price action when interpreting signals generated by indicators. Regular analysis and practice will help traders gain confidence and improve their trading skills over time.
| Indicator | Function | Characteristics |
|---|---|---|
| Moving Average (MA) | Identify trends and potential reversals | Smooths out price fluctuations |
| Relative Strength Index (RSI) | Measure speed and change of price movements | Indicate overbought and oversold conditions |
| Bollinger Bands | Indicate market volatility | Potential breakout or reversal signals |
| Moving Average Convergence Divergence (MACD) | Generate buy or sell signals | Combines two moving averages |
The top indicators for USDINR trading are Moving Averages, Bollinger Bands, Relative Strength Index (RSI), Stochastic Oscillator, and MACD.

Moving Averages help in USDINR trading by identifying the trend direction and providing entry and exit signals. The most commonly used moving averages are the 50-day and 200-day moving averages.
Bollinger Bands can be used in USDINR trading to identify volatility and potential price reversals. When the price is near the upper band, it may be overbought, and when it is near the lower band, it may be oversold.
The Relative Strength Index (RSI) indicator helps in USDINR trading by indicating whether a currency pair is overbought or oversold. A reading above 70 suggests overbought conditions, while a reading below 30 suggests oversold conditions.
The MACD indicator is significant in USDINR trading as it helps identify potential trend reversals and provides buy and sell signals. It consists of a MACD line and a signal line, and when the MACD line crosses above the signal line, it generates a bullish signal.
USDINR trading refers to the buying and selling of the USD (United States Dollar) against the INR (Indian Rupee) in the foreign exchange market. It involves speculating on the exchange rate between these two currencies.
Indicators in forex trading are tools used by traders to analyze the price movement and predict future market trends. They are mathematical calculations based on historical price and volume data, and they help traders make informed decisions about when to enter or exit trades.

Understanding the Difference Between Doji and Evening Star Candlestick Patterns In the world of technical analysis, traders rely on various chart …
Read Article
What is the most traded CFD? Contracts for Difference (CFDs) have become increasingly popular in the trading world, offering investors the opportunity …
Read Article
Learn the 3 Essential Chords to Play Any Song Have you ever dreamed of playing your favorite songs on the guitar but feel intimidated by all those …
Read Article
Understanding the Meaning of BAC in Trading When it comes to trading, it’s important to understand the various terms and metrics that are used to …
Read Article
Can I get USD in Bangalore airport? When traveling to Bangalore, India, it is important to be prepared for your currency exchange needs, especially if …
Read Article
Is the Dollar to Peso Exchange Rate Going Up or Down? The exchange rate between the US dollar and the Mexican peso is a topic of great interest for …
Read Article


