


How to Find a Forex Mentor: A Step-by-Step Guide
Find the Perfect Forex Mentor to Accelerate Your Trading Success If you’re new to the world of Forex trading, finding a mentor can be a crucial step …
Read Article
In the world of technical analysis, traders rely on various chart patterns to identify potential price reversals and make trading decisions. Two popular patterns that traders often encounter are the Doji and Evening Star patterns. While both patterns indicate a potential reversal, they have distinct characteristics that traders need to understand in order to make informed decisions.
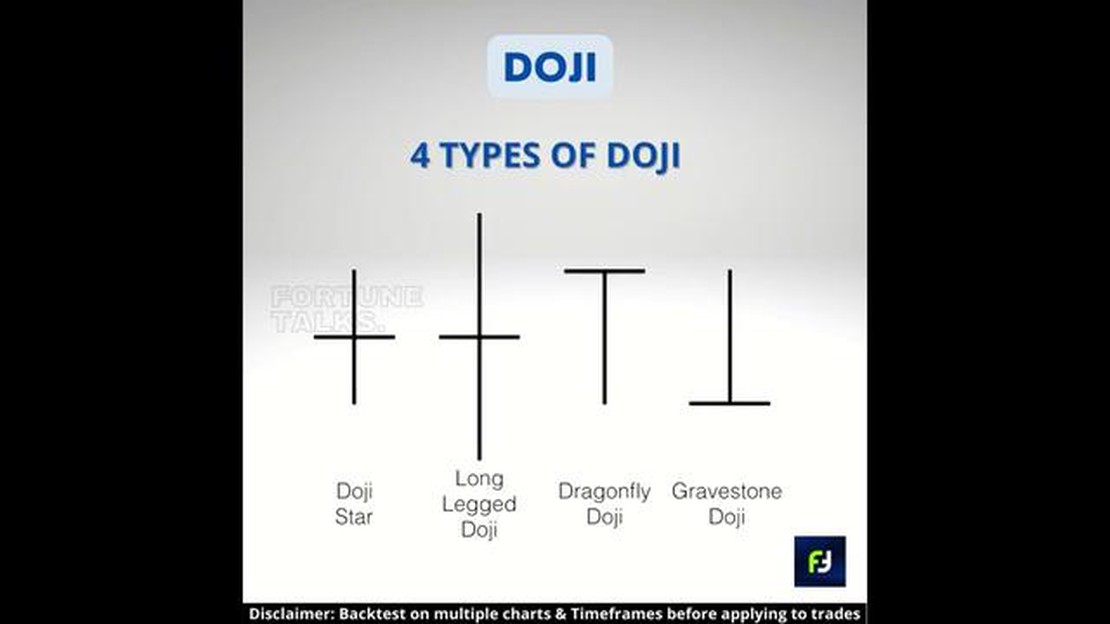
Doji patterns are formed when the opening and closing prices of an asset are very close to each other, creating a candlestick with a very short body. The Doji pattern signifies indecision in the market, as neither buyers nor sellers have been able to establish control. Traders often interpret a Doji pattern as a sign that a trend may be coming to an end, and a reversal may be imminent.
On the other hand, the Evening Star pattern is a bearish reversal pattern that consists of three candlesticks. The first candlestick is a large bullish one, indicating a strong uptrend. The second candlestick is a small-bodied one, which signifies indecision and a potential shift in momentum. The third candlestick is a large bearish one, confirming the reversal and indicating that sellers have gained control. Traders often view the Evening Star pattern as a strong indication that a bullish trend is coming to an end and a bearish trend may be starting.
While the Doji and Evening Star patterns may both indicate potential reversals in the market, it is important for traders to differentiate between the two. Understanding the characteristics and implications of each pattern can help traders make more accurate predictions and take advantage of market opportunities. Whether you are a seasoned trader or just starting out, recognizing and interpreting these patterns can greatly enhance your trading strategy and increase your chances of success.
The Doji and Evening Star patterns are two important candlestick patterns that traders use to assess market trends and make informed trading decisions. While both patterns provide indications of potential trend reversals, they have distinct characteristics that traders should understand.
A Doji pattern occurs when the open and close prices of a candlestick are very close or equal, resulting in a small or nonexistent body. The Doji indicates indecision in the market and suggests that the forces of supply and demand are evenly balanced. Traders see Doji patterns as potential signals of trend reversals, as they suggest that buyers and sellers are uncertain and that the current trend may be weakening.
The Evening Star pattern, on the other hand, is a three-candlestick pattern that occurs at the end of an uptrend. It consists of a large bullish candle, followed by a small candle with a gap up or down, and then a large bearish candle. The Evening Star pattern suggests a weakening of the uptrend and a potential reversal to a downtrend. It is considered a reliable bearish reversal pattern and provides traders with a signal to sell or short the asset.

Traders can combine these two patterns with other technical analysis tools, such as support and resistance levels or trendlines, to increase the probability of successful trades. By understanding the characteristics and implications of the Doji and Evening Star patterns, traders can make more informed decisions and improve their overall trading strategies.
A Doji is a popular candlestick pattern in technical analysis that suggests indecision in the market. It is formed when the opening and closing prices are the same or very close, creating a small or no body. The Doji pattern is often seen as a sign of potential market reversal.
Key Features of Doji Pattern:
Read Also: Is it possible to start trading for free?
Interpretation of Doji Pattern:
The Doji pattern is significant when it appears after a sustained trend. It suggests that the balance between buyers and sellers has become equal, and there is uncertainty about the future direction of the market. Traders often look for confirmation signals, such as a trend reversal pattern or a significant price move in the following candles, to make trading decisions based on the Doji pattern.
Depending on the position and context of the Doji, it can have different meanings:
Disclaimer: The Doji pattern should not be used as the sole basis for making trading decisions. It is important to analyze other technical indicators and consider the overall market conditions before taking any trading actions.
The evening star pattern is a bearish reversal pattern that can be found at the end of an uptrend. It is formed by three candlesticks: a large bullish candlestick, followed by a small bullish or bearish candlestick, and then a large bearish candlestick.
The first candlestick in the pattern is a large bullish candlestick that indicates a strong buying pressure and an ongoing uptrend.
Read Also: Understanding the Leverage of Vantage Markets: A Comprehensive Guide
The second candlestick is a small bullish or bearish candlestick that represents indecision in the market. It can be a doji, a hammer, or a spinning top candlestick. This indecision shows that the buyers are losing momentum and the trend may be nearing its end.
The third candlestick is a large bearish candlestick that confirms the reversal of the uptrend. It opens below the previous candlestick’s close and closes below its own open, indicating a strong selling pressure and a potential trend reversal.
The evening star pattern suggests that the bullish trend is weakening and the bears are gaining control. It is considered a reliable signal for traders to potentially sell or take short positions.

A Doji pattern is a candlestick pattern in technical analysis that occurs when the opening and closing prices of an asset are nearly equal. It indicates indecision or a tug-of-war between buyers and sellers.
An Evening Star pattern is formed by the combination of three candlesticks. The first candlestick is a long bullish candle, followed by a small-bodied candle with a gap up or down from the previous candle. Finally, a third candlestick with a long bearish body appears, indicating a potential reversal.
A Doji pattern indicates indecision in the market. It suggests that buyers and sellers are evenly matched, leading to a potential reversal or continuation of the current trend.
An Evening Star pattern is significant because it suggests a potential bearish reversal in the market. It indicates that the previous uptrend may be ending, and a new downtrend could be starting.
Yes, a Doji pattern can be a bullish signal depending on the context. If it occurs after a prolonged downtrend, it can indicate a potential reversal and a bullish trend starting. However, further confirmation is necessary to validate the signal.
A Doji pattern is a type of candlestick pattern in technical analysis that occurs when the opening and closing prices of an asset are very close or equal. It appears as a cross or a plus sign on the chart, with a very short or non-existent body.

Find the Perfect Forex Mentor to Accelerate Your Trading Success If you’re new to the world of Forex trading, finding a mentor can be a crucial step …
Read Article
Comparing EMA and DEMA: Which is the Better Moving Average? Technical analysis is an essential part of trading in the financial markets. Traders and …
Read Article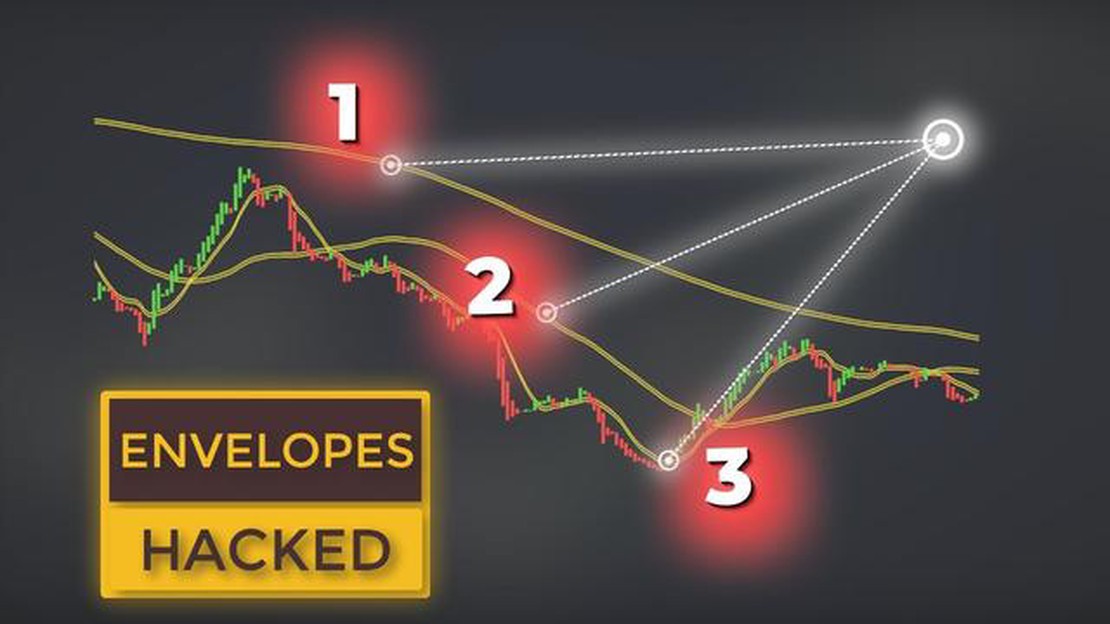
Understanding the Moving Average Envelope Shift For traders and investors, understanding how to effectively use technical indicators is crucial in …
Read Article
Which colour is best for trading? When it comes to the world of trading, every detail matters. From analyzing charts to deciphering complex patterns, …
Read Article
Understanding ECN Broker Commissions: Everything You Need to Know When it comes to choosing a broker for your trading activities, one of the key …
Read Article
When do 4-hour candles close? Understanding the timing of candlestick charts is essential for successful trading in the financial markets. One key …
Read Article


