


Discover the Wealthiest Female Forex Trader in Africa
Meet Africa’s Wealthiest Female Forex Trader Forex trading, also known as the foreign exchange market, is a decentralized global marketplace for …
Read Article
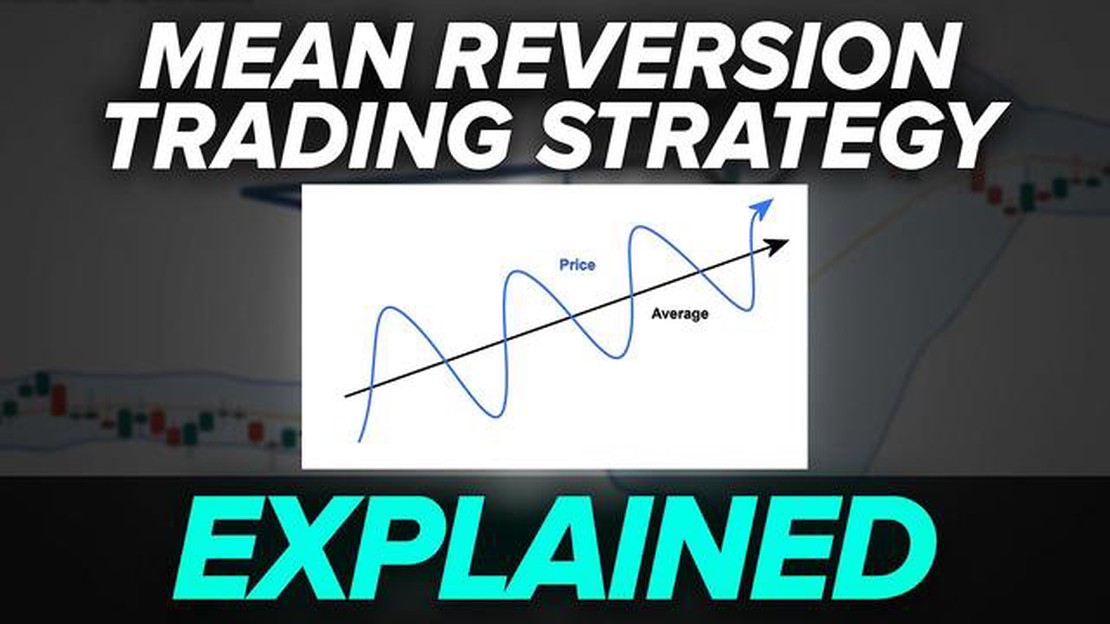
Mean Reversion trading is a popular strategy used by many traders and investors to profit from the temporary fluctuations in the price of an asset. This trading system is based on the belief that the price of an asset will eventually revert back to its mean or average, after experiencing deviations in either direction. By identifying these deviations and taking advantage of them, traders can potentially generate consistent profits.
But what exactly is mean reversion? In simple terms, it is the theory that prices and returns over time tend to move towards their average or mean values. This mean can be calculated using various statistical methods, such as moving averages or standard deviations. When an asset’s price moves too far away from its mean, whether it’s an overextension to the upside or the downside, mean reversion traders believe that it is likely to revert back to its mean in the near future.
The mean reversion trading system involves the identification of these deviations from the mean and the execution of trades based on the expectation of a reversion. Traders may use technical indicators, such as Bollinger Bands or RSI, to measure the extent of the deviation and determine potential entry and exit points. Additionally, fundamental analysis and market analysis can also be used to identify factors that might contribute to mean reversion.
It is important to note that mean reversion trading is not without its risks. The market can continue to deviate from the mean for extended periods, resulting in significant losses if trades are not managed properly. Therefore, risk management and proper position sizing are crucial components of successful mean reversion trading. Traders must be disciplined and have a clear plan in place to protect their capital and minimize potential losses.
In conclusion, understanding the mean reversion trading system can provide traders with a valuable tool to capitalize on short-term price fluctuations. By identifying deviations from the mean and taking advantage of them, traders can potentially generate consistent profits. However, it is important to approach mean reversion trading with caution and to implement proper risk management strategies to mitigate potential losses.
Mean reversion is a trading strategy that is based on the belief that prices tend to move towards the mean or average value over time. In other words, when the price of an asset deviates from its historical average, it is expected to revert back to that average.

Mean reversion is rooted in the concept of market efficiency, which assumes that financial markets are not completely efficient and that prices can deviate from their fair value due to various factors such as investor sentiment, market trends, and economic conditions. This creates opportunities for traders to profit from the price movements.
The mean reversion strategy involves identifying assets that have a tendency to revert to their mean and taking advantage of these price deviations. Traders look for overbought or oversold conditions, where the price has moved too far away from its average, and then enter a trade with the expectation that the price will reverse and move back towards the mean.
There are various indicators and tools that can be used to identify mean reversion opportunities, such as moving averages, Bollinger Bands, and oscillators like the Relative Strength Index (RSI). Traders also use statistical measures such as standard deviation and z-scores to quantify the deviation from the mean and determine entry and exit points for their trades.
Mean reversion can be applied to various financial markets, including stocks, bonds, commodities, and currencies. It is often used in short-term trading strategies, as the price deviations tend to be temporary and the market eventually reverts back to its equilibrium.
It is important to note that mean reversion is not a guaranteed strategy and traders should always use proper risk management techniques. Prices can deviate from the mean for extended periods of time, and there is always a risk of further price movements against the trader’s position. Therefore, it is crucial to set stop-loss orders and have a well-defined exit strategy.
Read Also: How to calculate moving average in C | Complete Guide
In conclusion, mean reversion is a trading strategy that seeks to profit from the tendency of prices to revert back to their mean or average value. It is based on the belief that markets are not always efficient and that price deviations present trading opportunities. Traders can use various indicators and tools to identify mean reversion opportunities and implement appropriate risk management techniques to mitigate potential losses.
Mean reversion trading is a popular strategy used by traders to capitalize on the concept that price tends to revert to its mean or average over time. It is based on the belief that price deviations from the mean are temporary and that the price will eventually revert back to its long-term average.
The mean reversion trading system typically involves identifying assets that are overbought or oversold based on certain indicators. Traders then take positions in the opposite direction of the current trend, betting that the price will revert to its mean.
One of the key indicators used in mean reversion trading is the Bollinger Bands. These bands measure volatility by using a statistical calculation based on the standard deviation of price. When the price moves outside of the upper or lower bands, it is considered overbought or oversold, indicating a potential mean reversion opportunity.
Read Also: Trading Options on Etrade: Margin Account or Not?
Another common indicator used in mean reversion trading is the Relative Strength Index (RSI). The RSI compares the magnitude of recent price gains to recent price losses to determine whether an asset is overbought or oversold. A high RSI value indicates overbought conditions, while a low RSI value indicates oversold conditions, signaling a potential mean reversion trade.
Once an asset is identified as overbought or oversold, traders can take positions by either buying or selling. If an asset is overbought, traders can sell the asset in anticipation of a price decline. Conversely, if an asset is oversold, traders can buy the asset in anticipation of a price increase.
It’s important to note that mean reversion trading is not without risks. While price deviations from the mean are expected to be temporary, they can sometimes persist for extended periods or even become permanent. Traders must exercise caution and implement proper risk management strategies to mitigate potential losses.
In conclusion, mean reversion trading is a strategy that aims to capitalize on the tendency of price to revert to its mean over time. Traders use various indicators, such as Bollinger Bands and the RSI, to identify overbought or oversold assets and take positions in the opposite direction of the current trend. However, traders must be mindful of the risks involved and implement proper risk management to ensure success in mean reversion trading.
Yes, mean reversion trading can be a profitable strategy if implemented correctly. It involves buying assets that have performed poorly in the hope that they will revert back to their average or baseline level. However, it is important to note that not all trades will be profitable, and careful risk management is necessary.

Mean reversion trading involves identifying assets that have deviated from their average or baseline level and entering a trade to profit from their eventual return to that level. Traders use various indicators and statistical measures to identify these deviations and determine entry and exit points for their trades.
Some commonly used indicators in mean reversion trading include Bollinger Bands, Relative Strength Index (RSI), and Moving Averages. These indicators help traders identify overbought or oversold conditions, which can suggest that an asset is due for a reversion to its mean or average level.
Yes, there are risks associated with mean reversion trading. One of the main risks is the possibility of a prolonged or permanent deviation from the mean, which can result in losses if the trade is not managed properly. It is important for traders to use risk management techniques, such as setting stop-loss orders, to limit potential losses.
Yes, mean reversion trading can be applied to various financial markets, including stocks, commodities, and forex. The basic principle of identifying assets that have deviated from their mean or average level applies to any market. However, it is important to adapt the strategy to the specific market conditions and characteristics of each asset.

Meet Africa’s Wealthiest Female Forex Trader Forex trading, also known as the foreign exchange market, is a decentralized global marketplace for …
Read Article
Understanding FX Leverage: How it Works and Its Benefits Trading on margin, also known as leverage, can be a powerful tool for traders in the foreign …
Read Article
Learn how to use the EMA crossover strategy for trading The exponential moving average (EMA) cross over strategy is a popular technical analysis tool …
Read Article
Are Backdated Stock Options Illegal? Backdating stock options has been a controversial practice that has gained significant attention in recent years. …
Read Article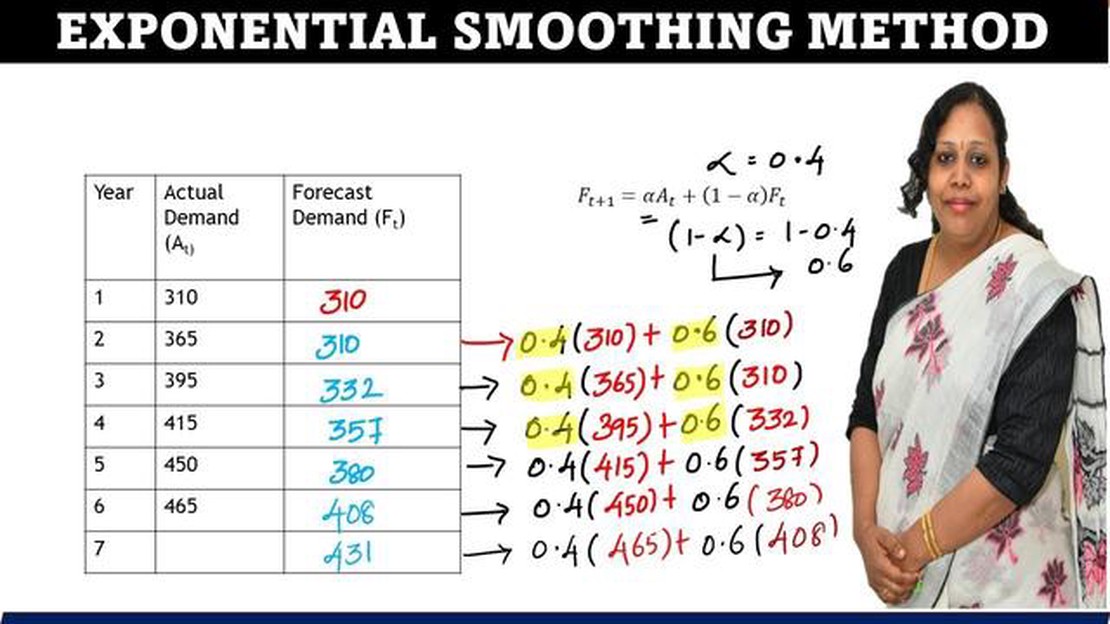
How to Determine the Value of the Smoothing Constant in Exponential Smoothing Method Exponential smoothing is a widely used technique in forecasting …
Read Article
Understanding the effectiveness of supply and demand in the forex market Supply and demand is an essential concept in the forex market. It refers to …
Read Article


