


What is the current value of a dollar?
What is the current value of a dollar? In today’s global economy, the value of a dollar is a subject of great interest and concern. The value of a …
Read Article
Bollinger Bands are a widely used technical indicator in financial markets. They were created by John Bollinger in the early 1980s to provide a visual representation of price volatility. Bollinger Bands consist of a centerline, which is a simple moving average, and two outer bands, which are standard deviations away from the centerline.
The calculation method for Bollinger Bands involves several steps. First, a period is chosen, typically 20 days, which represents the number of data points used in the calculation. The centerline is then calculated as the simple moving average of the closing prices over the chosen period.
The next step is to calculate the standard deviation of the closing prices over the same period. This measures the dispersion of the data points around the centerline. The standard deviation is then multiplied by a chosen factor, typically 2, to determine the distance between the centerline and the outer bands.
The upper band is calculated by adding the multiplied standard deviation to the centerline, while the lower band is calculated by subtracting it. These bands represent a range within which the price is expected to move most of the time, based on historical price data.
Understanding the calculation method for Bollinger Bands is crucial for traders and investors who use them as a tool for technical analysis. By knowing how they are calculated, one can better interpret the information provided by these bands and make more informed trading decisions.
Bollinger Bands are a technical analysis tool that was developed by John Bollinger in the 1980s. They are used to measure volatility and identify potential overbought or oversold conditions in the financial markets. Bollinger Bands consist of a centerline, an upper band, and a lower band, which are calculated using a specific formula.
The centerline of the Bollinger Bands is a simple moving average (SMA) of the price data. The upper and lower bands are typically set two standard deviations away from the centerline. This distance can be adjusted based on the trader’s preference and the specific market conditions being analyzed.
Bollinger Bands dynamically expand and contract as price volatility increases or decreases. When the market is more volatile, the bands widen, and when the market becomes less volatile, the bands narrow. The widening of the bands indicates a higher level of price volatility, while the narrowing of the bands suggests a lower level of volatility.
Bollinger Bands can be used in various ways to analyze market conditions and generate trading signals. Traders often look for price action near the bands to determine potential entry or exit points. For example, if the price touches or crosses the upper band, it may signal an overbought condition and a potential reversal may occur. Similarly, if the price touches or crosses the lower band, it may indicate an oversold condition and a potential reversal may occur from there.
Additionally, Bollinger Bands can be used in conjunction with other technical indicators to confirm or enhance trading signals. Some traders use Bollinger Bands in combination with oscillators such as the Relative Strength Index (RSI) or the Stochastic Oscillator to identify overbought or oversold conditions more accurately.

In conclusion, Bollinger Bands are a popular technical analysis tool that helps traders identify volatility, overbought or oversold conditions, and potential trading opportunities. By analyzing price action near the bands and considering other technical indicators, traders can make more informed trading decisions.
Bollinger Bands are a popular technical analysis tool that can be used to analyze and interpret financial data. They were developed by John Bollinger and are widely used by traders and investors to identify trends, volatility, and potential reversals in the markets.
One of the key reasons why Bollinger Bands are so important is that they provide a visual representation of price volatility. The bands consist of three lines: the middle line, which is a simple moving average (SMA) of the price; and the upper and lower bands, which are calculated based on the standard deviation of the price from the middle line.
Read Also: Is RadioShack Involved in Cryptocurrency? | Exploring the Connection
By using Bollinger Bands, traders can determine the current level of volatility in the market. When the price is trading within the bands, it suggests that the market is in a period of low volatility. Conversely, when the price moves outside of the bands, it indicates a period of high volatility.
Another important aspect of Bollinger Bands is their ability to indicate potential reversals in the market. When the price reaches the upper band, it suggests that the market may be overbought and due for a downward correction. On the other hand, when the price touches the lower band, it indicates that the market may be oversold and due for an upward correction.
Bollinger Bands can also be used to identify trends in the market. When the price is trending upwards, it tends to stay above the middle line and near the upper band. Conversely, when the price is trending downwards, it tends to stay below the middle line and near the lower band.
Overall, Bollinger Bands are an invaluable tool for traders and investors alike. They can provide important insights into price volatility, potential reversals, and market trends. By understanding and utilizing Bollinger Bands, traders can make more informed decisions and improve their overall trading strategies.
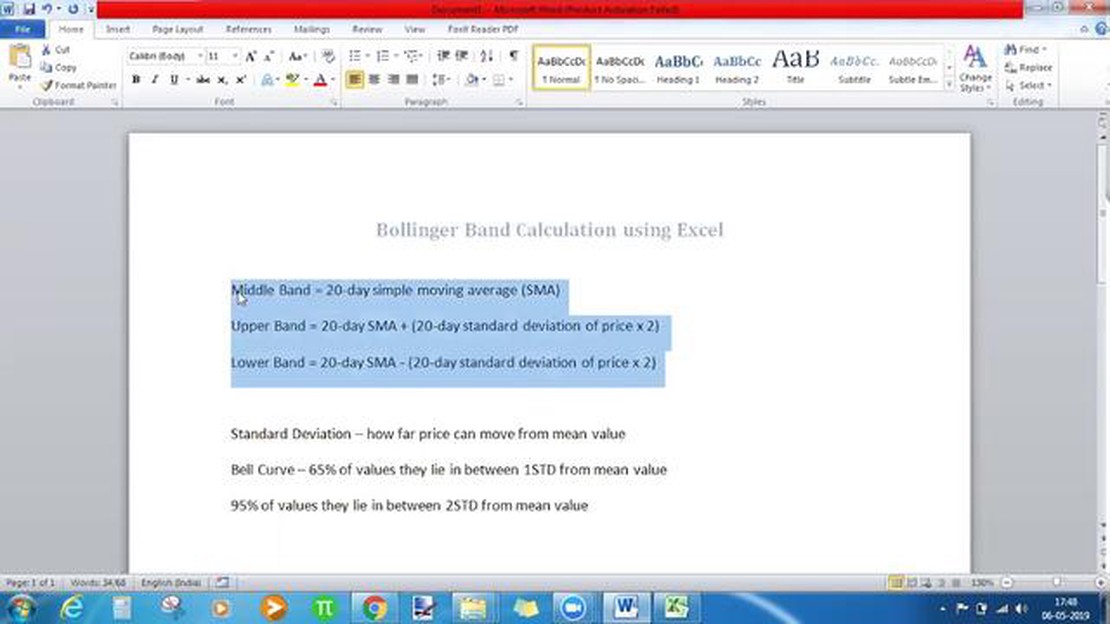
The calculation method for Bollinger Bands involves three key components: the middle band, the upper band, and the lower band. These bands are calculated based on the standard deviation of the price data over a specified period of time.
To calculate the middle band, the simple moving average (SMA) is used. The SMA is calculated by summing up the closing prices over the specified period and dividing the sum by the number of periods. This gives the average price over that time period.
Read Also: Understanding the 1 to 1 Forex Strategy | A Guide for Traders
The upper band is calculated by adding two standard deviations to the middle band. The standard deviation is a statistical measure of volatility. It quantifies the amount of variation or dispersion in a set of values. By adding two standard deviations to the middle band, the upper band provides an indication of potential resistance.
On the other hand, the lower band is calculated by subtracting two standard deviations from the middle band. This provides an indication of potential support levels. Traders often look for a price to touch or move below the lower band before considering it an oversold condition and a potential buying opportunity.
Calculation Steps

| Component | Calculation | | Middle Band | Simple Moving Average (SMA) | | Upper Band | Middle Band + (2 * Standard Deviation) | | Lower Band | Middle Band - (2 * Standard Deviation) |
These calculations allow traders to visualize volatility and potential support and resistance levels. Bollinger Bands can help identify overbought or oversold conditions, as well as track potential price breakouts. By understanding the calculation method, traders can better utilize Bollinger Bands as a tool in their trading strategies.
Bollinger Bands are a technical analysis tool that consists of a simple moving average (SMA) and two standard deviation bands plotted on a price chart. They are used to measure volatility and identify overbought or oversold conditions in a market.
Bollinger Bands are calculated using a mathematical formula. The middle band is a simple moving average of the price over a specified period of time (typically 20 periods). The upper band is calculated by adding two times the standard deviation of the price to the middle band, and the lower band is calculated by subtracting two times the standard deviation from the middle band.
The purpose of Bollinger Bands is to provide a visual representation of volatility in a market. They can help traders identify periods of high or low volatility, as well as potential reversal points in a market. Bollinger Bands can also be used to generate trading signals when the price crosses above or below the upper or lower band.
Bollinger Bands can be used to identify overbought or oversold conditions in a market by looking for price action that moves outside of the bands. When the price reaches or exceeds the upper band, it is considered overbought, and when it reaches or falls below the lower band, it is considered oversold. Traders can use these signals as a trigger to enter or exit trades.
Yes, Bollinger Bands can be used on any financial instrument, including stocks, bonds, commodities, and forex. They are a versatile tool that can be applied to any market that exhibits price volatility. However, it is important to adjust the parameters of the Bollinger Bands to suit the characteristics of the specific instrument being analyzed.
Bollinger Bands are a technical analysis tool that is used to measure the volatility of a financial instrument. They consist of three lines: a middle line that is the simple moving average (SMA) of the closing prices, and an upper and lower line that are calculated by adding and subtracting a multiple of the standard deviation from the middle line.

What is the current value of a dollar? In today’s global economy, the value of a dollar is a subject of great interest and concern. The value of a …
Read Article
Trading Currency Options: A Comprehensive Guide Currency options trading is a popular and widely used method for investors to speculate and profit …
Read Article
What is time trading system? In today’s fast-paced world, time is a valuable resource. We are constantly looking for ways to optimize our time …
Read Article
Is there a dom for forex trading? Forex trading, also known as foreign exchange trading, is the buying and selling of currencies on the global market. …
Read Article
Understanding support levels and resistance levels in trading Support and resistance levels are essential concepts in technical analysis that help …
Read Article
Is trading sim good? Trading simulators have become increasingly popular among traders of all levels of experience. These virtual trading platforms …
Read Article


