


Respiri Stock Price Forecast: Predicting Future Performance
What is the stock price forecast for Respiri? Investors are constantly on the lookout for ways to predict the future performance of stock prices. One …
Read Article
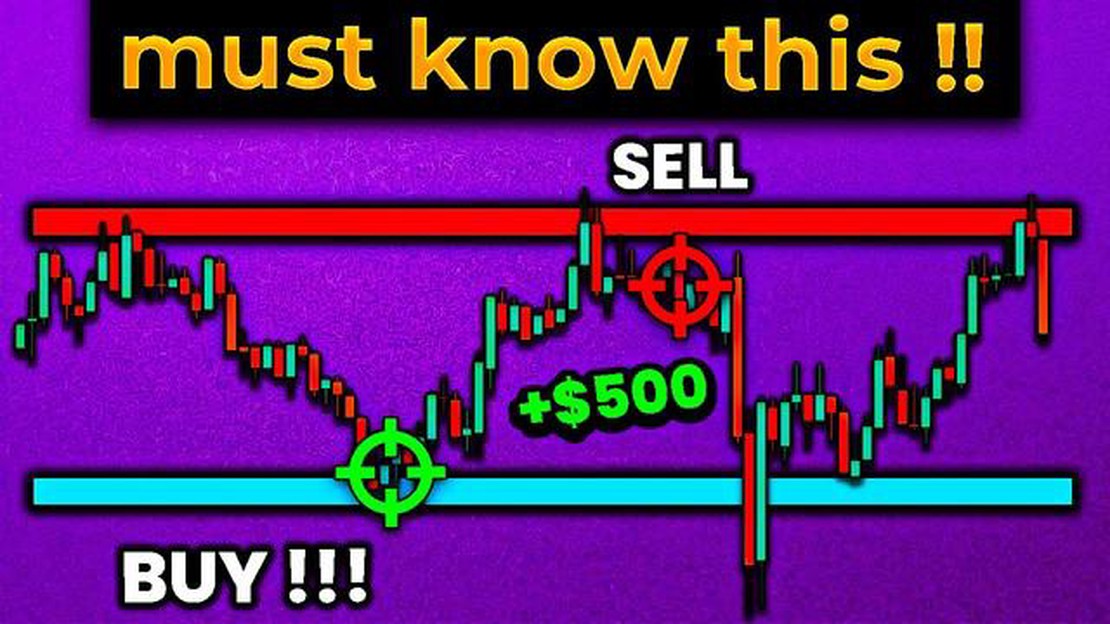
Support and resistance levels are essential concepts in technical analysis that help traders identify potential price levels at which a financial instrument is likely to encounter obstacles in its trend. By understanding these levels, traders can make more informed decisions when it comes to entering or exiting trades.
Support levels are price levels at which the demand for a financial instrument is expected to be strong enough to prevent it from falling further. These levels are often seen as a floor, providing a solid foundation for prices to bounce back from. Traders will typically look for signs of buying pressure at support levels, such as bullish candlestick patterns or increased trading volume.
Resistance levels, on the other hand, are price levels at which the supply for a financial instrument is expected to be strong enough to prevent it from rising further. These levels are often seen as a ceiling, capping the upside potential of prices. Traders will typically look for signs of selling pressure at resistance levels, such as bearish candlestick patterns or decreased trading volume.
Identifying support and resistance levels can be done using various technical analysis tools, such as trendlines, horizontal lines, or moving averages. These levels are not fixed, and they can change over time as market dynamics shift. Traders need to update their analysis regularly to stay on top of these key levels.

Overall, understanding support and resistance levels is crucial for any trader looking to improve their technical analysis skills. By being aware of these levels and how they interact with price action, traders can gain valuable insights into potential market trends and make more informed trading decisions.
Support and resistance levels are key concepts in technical analysis that help traders determine potential price levels at which an asset may experience a pause or reversal of its current trend.
Support levels refer to price levels at which a particular asset, such as a stock or cryptocurrency, tends to find buying pressure and thus prevent further downward movement. These levels act as a floor for the price, where demand for the asset is strong enough to counteract selling pressure and potentially push the price higher.
Resistance levels are price levels at which an asset tends to encounter selling pressure and prevent further upward movement. These levels act as a ceiling for the price, where supply of the asset is strong enough to counteract buying pressure and potentially push the price lower.
Read Also: Can You Make 100 Pips a Day in Forex? Discover the Truth Here!
Support and resistance levels can be identified by analyzing historical price data, chart patterns, and various technical indicators. Traders often use these levels to make trading decisions, such as buying at support levels and selling at resistance levels.
When an asset’s price breaks through a support level, it is often seen as a bearish signal, indicating that selling pressure has overcome buying pressure and the price may continue to decline. Conversely, when a price breaks through a resistance level, it is often seen as a bullish signal, suggesting that buying pressure has overcome selling pressure and the price may continue to rise.
Support and resistance levels can be horizontal, diagonal, or a combination of both. They can also change over time as market conditions and investor sentiment evolve. Traders typically monitor these levels closely and adjust their trading strategies accordingly.
Understanding support and resistance levels is crucial for technical analysts and traders as they provide important insights into the supply and demand dynamics of an asset. By identifying and utilizing these levels effectively, traders can potentially identify profitable trading opportunities and manage their risk more effectively.
In the world of technical analysis, support and resistance levels are key concepts used to identify potential price levels where an asset may experience a pause, reversal, or significant change in its price trend. These levels are determined based on past price action and are considered important psychological and strategic areas in the market.
Support levels refer to price points at which an asset tends to find buying interest and experiences a temporary halt in its downward trend. These levels are seen as areas where demand exceeds supply, causing buyers to enter the market and prevent the price from declining further. Traders and investors often consider support levels as ideal buying opportunities, as they believe that the price is likely to rebound and continue its upward movement from these levels.
Read Also: Understanding the Difference Between Knock-In and Knock-Out Options
Resistance levels, on the other hand, are price points at which an asset typically faces selling pressure and encounters a temporary barrier in its upward trend. These levels are seen as areas where supply exceeds demand, causing sellers to enter the market and prevent the price from rising further. Traders and investors often view resistance levels as optimal selling or shorting opportunities, as they anticipate that the price will struggle to surpass these levels and may experience a reversal or consolidation.
Support and resistance levels can be identified through various technical analysis tools and indicators, such as trendlines, moving averages, Fibonacci retracements, and horizontal price levels. These levels are not fixed and can shift over time as market conditions change. When an asset successfully breaks through a resistance level, it may become a new support level, and vice versa.
Understanding support and resistance levels is crucial for traders and investors as they provide valuable insights into market sentiment and potential price movements. The ability to identify and accurately interpret these levels can help traders make informed decisions about entry and exit points, risk management, and profit targets in their trading strategies.
Support and resistance levels in trading are specific price levels on a chart that tend to act as barriers, preventing the price of an asset from moving beyond a certain point. Support levels are considered the price points at which the asset’s price has historically had difficulty falling below, while resistance levels are the price points at which the asset’s price has historically struggled to surpass.

Support and resistance levels are determined by analyzing historical price data on a chart. Traders look for areas where the price has repeatedly reversed or stalled in the past, and these areas become potential support or resistance levels. Some commonly used methods to determine support and resistance levels include trendlines, Fibonacci retracements, moving averages, and pivot points.
Support and resistance levels are important for traders because they can provide valuable insights into the potential future price movement of an asset. When the price approaches a support level, it is an indication that there may be increased buying activity, and the price could potentially reverse or bounce back up. Similarly, when the price approaches a resistance level, it suggests increased selling activity, and the price may struggle to move higher.
Traders can use support and resistance levels in their trading strategies in several ways. One approach is to look for price reversals or bounces off these levels and enter trades accordingly. For example, if the price bounces off a support level, a trader may consider buying the asset with the expectation that it will continue to move higher. Another approach is to use support and resistance levels as targets or areas to set stop-loss orders to manage risk.

What is the stock price forecast for Respiri? Investors are constantly on the lookout for ways to predict the future performance of stock prices. One …
Read Article
What is the key to successful option trading? Option trading can be an exciting and potentially profitable venture, but it also comes with its fair …
Read Article
Can a company revoke vested stock options? Stock options are a popular form of compensation that many companies offer to their employees as a way to …
Read Article
What does W1 mean in trading? When it comes to trading in the financial markets, there are many indicators and tools that traders use to make informed …
Read Article
Is Forex Trading the Same as Gambling? Forex trading and gambling are often seen as similar activities that involve risk-taking and the potential for …
Read Article
Advantages of Binary Over Text Many people in the digital world may argue that text is the go-to format for communication and data storage. However, …
Read Article


