
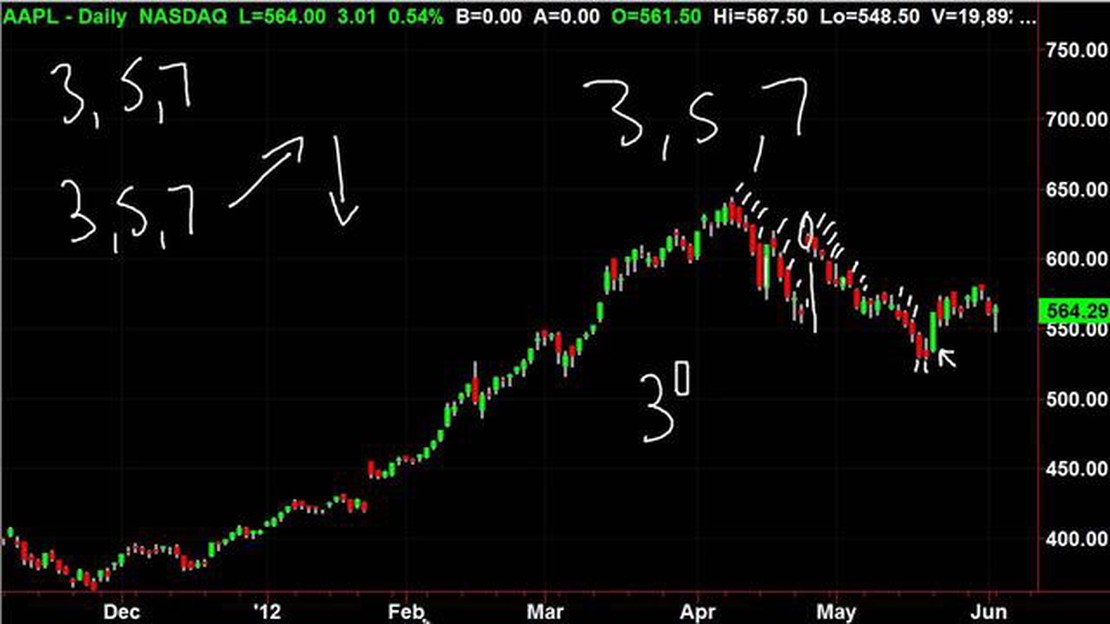

Understanding the Rule of 3, 5, and 7 in Trading: A Comprehensive Guide
Understanding the Rule of 3, 5 and 7 in Trading When it comes to trading, understanding key principles and strategies is essential for success. One …
Read Article
Moving averages are a popular tool used by traders and analysts to identify trends and make informed decisions in the financial markets. They provide valuable insights into the direction and strength of price movements, allowing investors to predict future price movements and adjust their trading strategies accordingly. In this article, we will explore the concept of moving averages, how they are calculated, and most importantly, how to interpret them to maximize profits.
The basic idea behind moving averages is to smooth out price fluctuations and identify the underlying trend. A moving average is simply an average of the price over a certain period of time, with each new data point replacing the oldest one. For example, a 50-day moving average will be calculated by adding up the closing prices of the past 50 days and dividing the sum by 50. This process is repeated for each trading day, creating a continuous line that represents the average price over the specified period.
There are different types of moving averages, including simple moving averages (SMA) and exponential moving averages (EMA). While SMAs give equal weight to all data points, EMAs assign more weight to recent prices, making them more responsive to recent price changes. Traders often use a combination of different moving averages to get a better understanding of the overall trend.
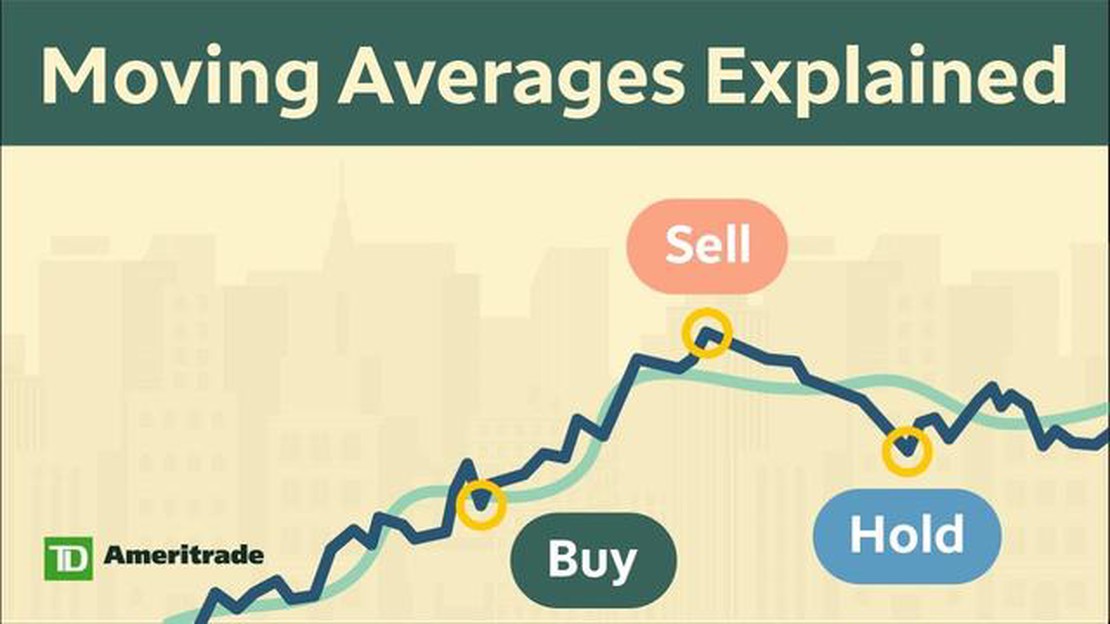
Interpreting moving averages is a matter of understanding the relationship between the price and the moving average line. When the price is above the moving average, it is generally considered bullish, indicating an uptrend. Conversely, when the price is below the moving average, it is considered bearish, indicating a downtrend. Traders look for crossovers, where the price crosses above or below the moving average, as potential buy or sell signals.
It’s important to note that moving averages are not foolproof and should be used in conjunction with other technical indicators and market analysis. They are just one tool among many that can help traders make more informed decisions. By combining moving averages with other indicators, such as volume and momentum, traders can gain a more comprehensive view of the market and increase their chances of success.
In conclusion, moving averages are a powerful tool that can help traders navigate the complex world of financial markets. By understanding how to interpret moving averages, traders can identify trends, spot potential buying and selling opportunities, and ultimately make more informed decisions. However, it is crucial to remember that no single indicator can guarantee success, and proper risk management and analysis are essential for long-term profitability.

In the world of financial market analysis, moving averages are an essential tool for making informed decisions. A moving average is a calculation that helps traders and investors understand the overall trend of a stock or market over a specific period of time. It smooths out price fluctuations and allows for a clearer interpretation of price data.
A moving average is calculated by taking the average price of a stock or market over a specified number of trading days. For example, a 50-day moving average would calculate the average price of the past 50 trading days. As each new trading day occurs, the oldest price in the calculation is dropped, and the newest price is added. This creates a constantly evolving line on a price chart that shows the average price over the specified period.
There are different types of moving averages that traders and investors use, such as simple moving averages (SMA) and exponential moving averages (EMA). Simple moving averages give equal weight to each price point in the calculation, while exponential moving averages give more weight to recent prices. The choice of which moving average to use depends on the trader’s or investor’s preferred strategy and the specific market being analyzed.
Moving averages can be used in various ways to analyze market trends and make trading decisions. One common method is to look for crossovers, where a shorter-term moving average crosses above or below a longer-term moving average. A bullish crossover, where the shorter-term moving average crosses above the longer-term moving average, indicates a potential buy signal. Conversely, a bearish crossover, where the shorter-term moving average crosses below the longer-term moving average, indicates a potential sell signal.
Read Also: Unusual Option Activity in Market Rebellion: What You Need to Know
Another way to interpret moving averages is to look for support and resistance levels. In an uptrend, the price of a stock or market may bounce off a rising moving average, providing a level of support. In a downtrend, the price may struggle to break through a declining moving average, acting as a level of resistance. These levels can help traders identify potential entry or exit points.
It’s important to remember that moving averages are lagging indicators, meaning they are based on past price data. They do not predict future price movements with certainty, but rather provide insight into the historical behavior of a stock or market. Traders and investors often use moving averages in conjunction with other technical indicators and fundamental analysis to make well-informed decisions.
Read Also: What are Options in Forex? Understanding the Basics of Forex Options
In conclusion, understanding moving averages is crucial for anyone involved in financial market analysis. They provide a valuable tool for interpreting price data, identifying trends, and making informed trading decisions. By using moving averages in conjunction with other analysis techniques, traders and investors can gain a deeper understanding of the market and improve their chances of success.
A moving average is a technical indicator that smooths out price data by creating a constantly updated average over a specific period of time.
To calculate a moving average, you need to add up a certain number of closing prices and then divide the sum by the number of periods.
Moving averages are used to identify trends and potential support and resistance levels in a market. They can also help traders determine entry and exit points for trades.

A simple moving average gives equal weight to all prices in the calculation, while an exponential moving average gives more weight to the most recent prices.
Moving averages can provide valuable information about the current trend and momentum of a market. Traders can use them to identify potential buying or selling opportunities, as well as set stop-loss levels and target prices.
A moving average is a calculation used to analyze data points by creating a series of averages of different subsets of the full data set.
Moving averages help in making informed decisions by smoothing out data and identifying trends or patterns over a specific period of time. They can be used to determine entry or exit points for trades, identify potential support and resistance levels, and confirm the strength or weakness of a trend.

Understanding the Rule of 3, 5 and 7 in Trading When it comes to trading, understanding key principles and strategies is essential for success. One …
Read Article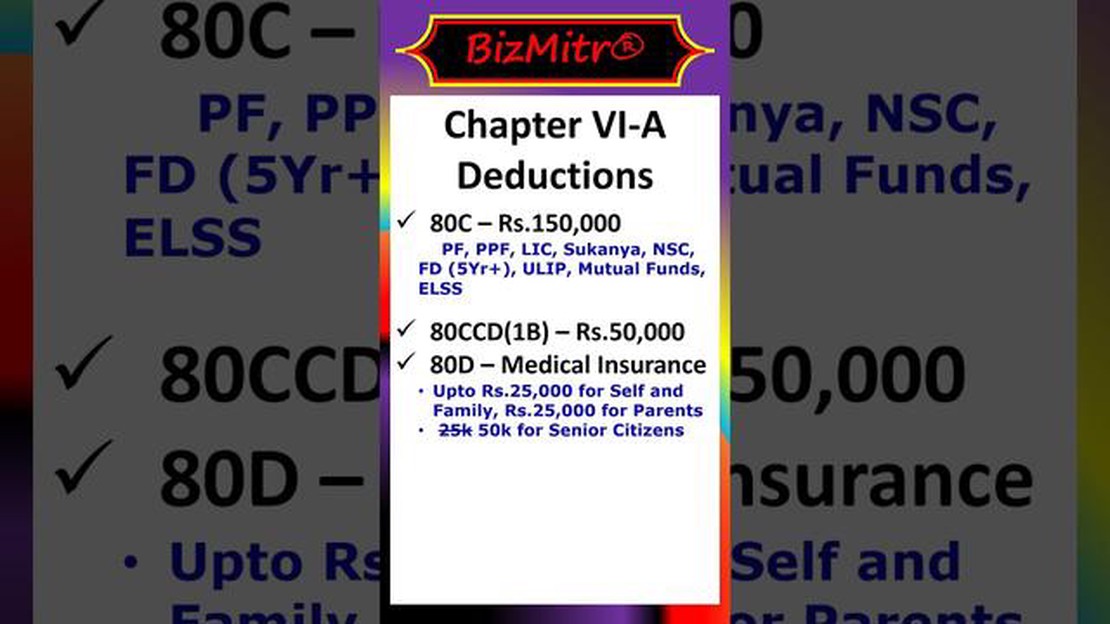
What is the 110 1 D deduction? In the world of tax deductions, the 110 1-D deduction stands out as one of the most valuable and widely used. However, …
Read Article
Understanding the Mechanics of Derivatives Welcome to YourSiteName, where we explore the world of finance and investments. In this article, we will …
Read Article
The Headline of the Equity Trader Resume: Examples and Tips When it comes to a career in equity trading, having the right skills and experience can …
Read Article
Exponentially Weighted Moving Average in Deep Learning Deep Learning is a constantly evolving field, with new techniques and algorithms being …
Read Article
The Advantages of a Stock Swap Stock swaps have become an increasingly popular method for business mergers and acquisitions. This exchange of stocks …
Read Article


