


Is Butterfly Strategy Effective? Benefits and Drawbacks Explained
Is butterfly strategy good? When it comes to investment strategies, the butterfly approach has gained significant attention in recent years. This …
Read Article
When analyzing data over time, especially in fields such as finance, the moving average is a commonly used indicator to understand trends and patterns. The moving average helps smooth out fluctuations in data by calculating the average value of a specific period, such as months or years.
To calculate the monthly moving average, you need to gather the data points for each month and apply a specific formula. The formula involves adding up the values for a certain number of months and then dividing the sum by that same number. This process is repeated for each month, resulting in a series of monthly moving averages.
For example, if you have 12 months of data, you can calculate the 12-month moving average by adding up the values for each of the 12 months and dividing the sum by 12. This will give you the average value for that particular month. Next, you move on to the next month and calculate the average using the data for the previous 12 months, and so on.
The monthly moving average is useful because it helps identify trends and patterns that may not be apparent when looking at the raw data. By smoothing out fluctuations, it provides a clearer picture of the overall direction of the data. This can be particularly helpful in forecasting future values and making informed decisions.
Moving averages are an important tool in financial analysis and forecasting. They provide a smoothed out representation of data over a specific time period, making it easier to identify trends and patterns. One common variation of moving averages is the monthly moving average, which calculates the average of data points over a month.

Calculating the monthly average is important because it helps to eliminate short-term fluctuations in data, allowing for a clearer understanding of long-term trends. This is particularly useful when analyzing financial data, where short-term volatility can often cloud the bigger picture.
The formula for calculating the monthly moving average involves summing up the data points for a specific month and dividing the sum by the number of data points. This produces a single value that represents the average of that month. This process is then repeated for each month in the dataset, resulting in a series of monthly average values.
By calculating the monthly moving average, analysts can identify the overall direction of a trend and make more informed decisions. For example, if the monthly moving average shows an upward trend, it suggests that the data is increasing over time. Conversely, a downward trend indicates that the data is decreasing.
Read Also: Understanding the Concept of .01 Lot Size in Forex and Its Significance
Additionally, the monthly moving average can help to smooth out seasonality effects, which are recurring patterns that can impact data. For example, retail sales tend to be higher during the holiday season. By calculating the monthly average, these seasonal fluctuations can be minimized, making it easier to identify underlying trends.
In conclusion, understanding moving averages and the importance of calculating the monthly average is crucial for effective financial analysis. It helps to eliminate short-term fluctuations, identify trends, and make more informed decisions. By using this tool, analysts can gain a better understanding of the underlying patterns in their data.
Calculating the monthly moving average is a useful way to analyze data over time and identify trends or patterns. This calculation involves taking the average of a set of data points over a specific time period and updating it as new data becomes available. The formula for calculating the monthly moving average is relatively simple and can be implemented using basic mathematical operations.
To calculate the monthly moving average, you need to follow these steps:
To illustrate this formula, let’s consider an example. Let’s say you want to calculate the monthly moving average of sales for a particular product over a year. You have monthly sales data for the entire year, and you want to analyze the trend in sales over time.
First, you would select the sales data for the first month, add up the values, and divide by the number of data points to calculate the average. Then, you would move to the next month, update the set of data points, and recalculate the average. This process would continue for each month in the year, until you have calculated the moving average for all twelve months.
The resulting moving average values can then be plotted on a graph to visualize the trend in sales over time. This can help identify any upward or downward trends, detect seasonality patterns, or highlight any unusual fluctuations in sales.
| Time Period | Sales Data | Moving Average |
|---|---|---|
| Month 1 | 100 | - |
| Month 2 | 120 | 110 |
| Month 3 | 150 | 123.33 |
| … | … | … |
Read Also: Understanding the ABC Chart Pattern: A Comprehensive Guide
In the example table above, the sales data for each month is listed, and the moving average is calculated based on the previous months’ data. As you can see, the moving average gradually changes as new data is included in the calculation, providing a smoothed representation of the sales trend.
Overall, the formula for calculating the monthly moving average allows you to analyze data over time and identify patterns or trends. By updating the set of data points and recalculating the average as new data becomes available, you can track changes in the trend and make data-driven decisions based on the insights gained from the moving average.
Calculating the monthly moving average is important because it helps to smooth out short-term fluctuations in data and gives a clearer picture of the overall trend. It is a useful tool for understanding patterns and making predictions based on historical data.

The formula for calculating the monthly moving average is to add up the values of the data points for a specific time period (in this case, a month) and divide the sum by the number of data points in that time period.
Yes, the monthly moving average can be used for any type of data that is measured over time. It is commonly used in finance and stock market analysis, but can also be applied to other areas such as sales data, population trends, and weather patterns.
The length of the time period for calculating the monthly moving average can vary depending on the data and the desired level of smoothness. It is common to use a time period of 3, 6, or 12 months, but it can be adjusted to fit the specific needs of the analysis.
The monthly moving average is not specifically designed for detecting outliers in the data, but it can help to identify unusual fluctuations and trends. By smoothing out the data, it can make it easier to spot irregularities that may indicate outliers or anomalies.

Is butterfly strategy good? When it comes to investment strategies, the butterfly approach has gained significant attention in recent years. This …
Read Article
Can I withdraw money from Bitsafe? Withdrawal processes can be confusing, especially when it comes to digital wallets like Bitsafe. However, …
Read Article
Exchange rate: USD to EGP 1000 If you are planning on traveling to Egypt or doing business with Egyptian partners, it is crucial to stay up-to-date …
Read Article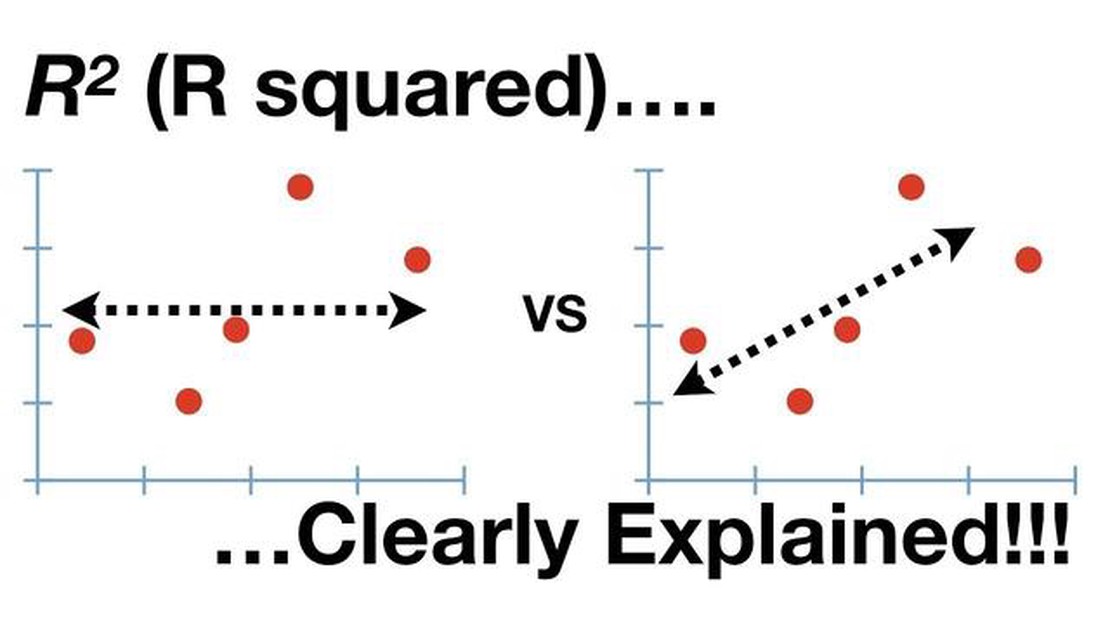
Understanding R2: A Beginner’s Guide to R2 Regression The coefficient of determination, also known as R2, is a statistical measure used to assess the …
Read Article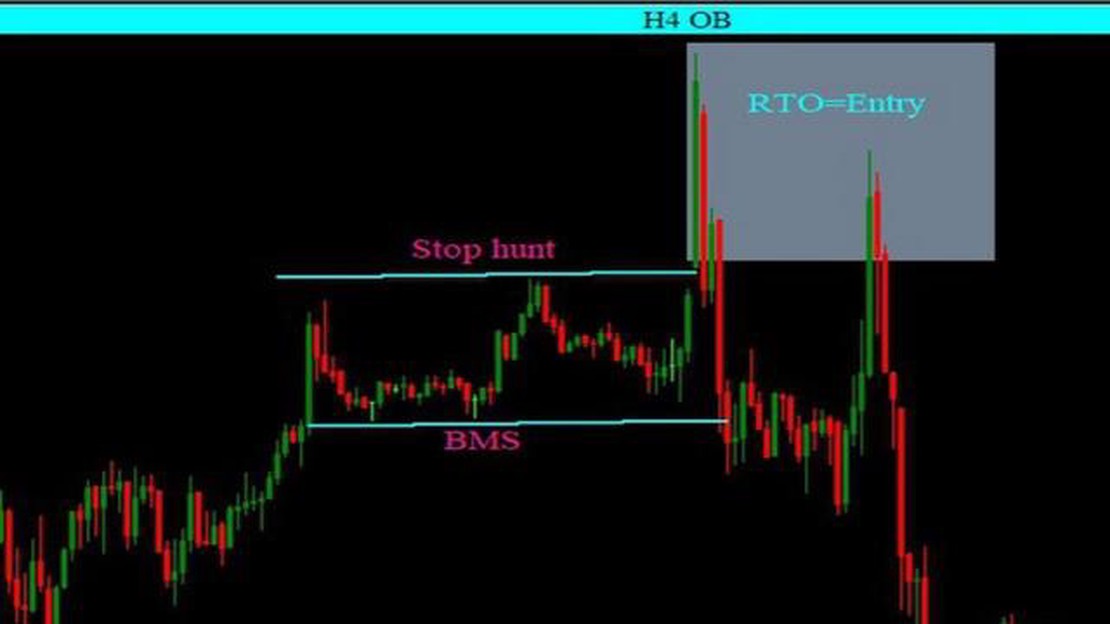
What is SMS and BMS? In today’s digital age, communication plays a vital role in our everyday lives. One of the most widely used forms of …
Read Article
Learn how to trade like a pro trader Trading in financial markets can be both exciting and profitable. Many people dream of becoming successful …
Read Article


