


Does TradingView Offer Options Trading? Find Out Here!
TradingView Options: Everything You Need to Know If you’re an options trader or are interested in exploring options trading, you may be wondering if …
Read Article
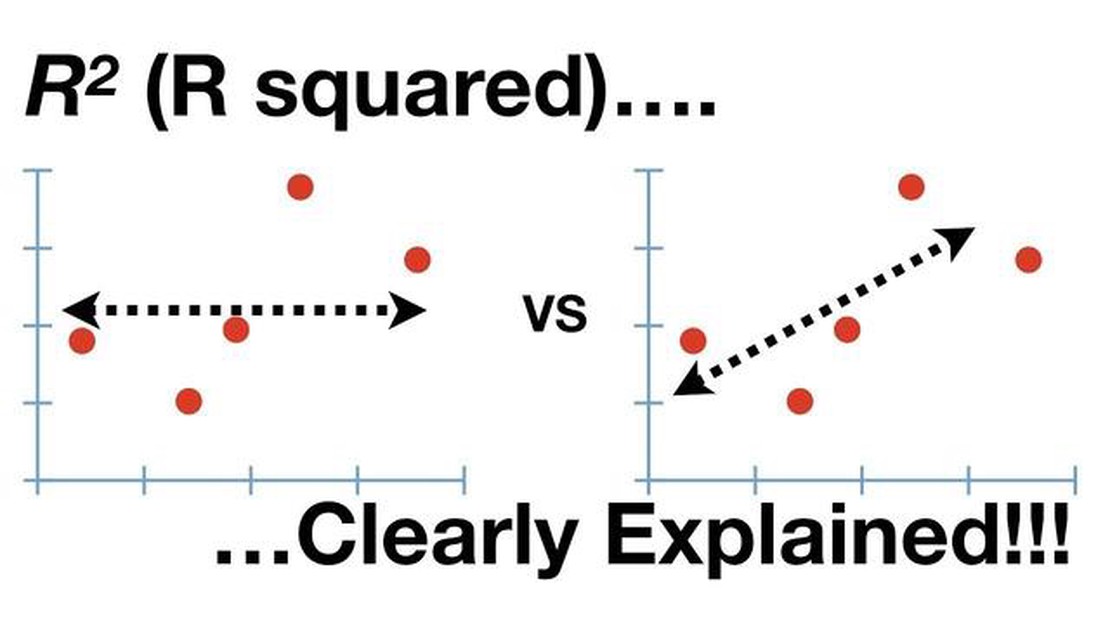
The coefficient of determination, also known as R2, is a statistical measure used to assess the quality of a regression model. It provides an indication of how well the model fits the observed data. R2 takes values between 0 and 1, with a higher value indicating a better fit.
Simply put, R2 tells us the proportion of the dependent variable’s variance that is explained by the independent variables in the model. It quantifies the amount of variability in the response variable that can be attributed to the predictors. A value of 1 means that all of the variability is explained by the model, while a value of 0 suggests that the model does not explain any of the variability.
R2 is a crucial metric in regression analysis as it helps determine whether the model is a good fit for the data. If R2 is close to 1, it suggests that the model captures a large portion of the variance and can make accurate predictions. On the other hand, a low R2 value indicates that the model may not be capturing the underlying patterns effectively and might not be reliable for predictions.
It is important to note that R2 is not without limitations. It cannot determine the causality of relationships between variables and may be influenced by the presence of outliers or influential data points. Additionally, R2 can be misleading if used to compare models with different variables or transformations. Therefore, it is essential to consider other factors and diagnostic measures when evaluating the overall goodness of fit of a regression model.
In conclusion, the coefficient of determination, R2, is a valuable tool in regression analysis that measures the proportion of variance in the dependent variable explained by the independent variables. It provides insights into the quality and predictive power of the model. While R2 is a useful metric, it should be interpreted alongside other diagnostic measures to ensure a comprehensive evaluation of the regression model.
R2, or the coefficient of determination, is a statistical measure that represents the proportion of the variance in the dependent variable that can be explained by the independent variable(s) in a linear regression model. In other words, R2 measures how well the observed data fits the regression model.
R2 ranges from 0 to 1, where 0 indicates that the independent variable(s) cannot explain any of the variance in the dependent variable, and 1 indicates that the independent variable(s) can explain all of the variance. An R2 value of 0.5, for example, means that 50% of the variance in the dependent variable can be explained by the independent variable(s).
R2 is often interpreted as the percentage of the variance in the dependent variable that is “explained” by the independent variable(s). However, it is important to note that R2 does not imply causation. A high R2 value does not necessarily mean that the independent variable(s) cause changes in the dependent variable.
It is also worth mentioning that R2 can be misleading when used inappropriately. For example, adding more independent variables to a regression model will usually increase R2, even if the additional variables do not have any meaningful relationship with the dependent variable. Therefore, it is important to interpret R2 in the context of the specific regression model and the variables included.

In summary, R2 is a useful measure for assessing the goodness-of-fit of a regression model. It provides insights into how well the independent variable(s) explain the variance in the dependent variable. However, it should be used cautiously and in conjunction with other statistical measures to draw valid conclusions from a regression analysis.
The coefficient of determination, commonly known as R2, is a statistical measure that represents the proportion of the variance in the dependent variable that can be explained by the independent variable(s) in a regression model. R2 is an important metric in regression analysis as it provides insights into the quality and usefulness of the model.
A high value of R2 indicates that a large proportion of the variability in the dependent variable can be explained by the independent variable(s) in the model. This implies that the model is able to capture a significant amount of the underlying relationship between the variables. On the other hand, a low value of R2 suggests that the model is not able to capture much of the variability in the dependent variable, indicating that the independent variable(s) have little or no influence on the outcome.
R2 is often used as a benchmark to compare different regression models. By comparing the R2 values of different models, researchers can determine which model provides the best fit to the data. Additionally, R2 can also be used to assess the effectiveness of adding or removing independent variables from a model. If the R2 value increases significantly after adding a new variable, it suggests that the variable contributes to explaining the variability in the dependent variable.
Read Also: Step-by-Step Guide on How to Check Your MT4 Account
However, it is important to note that R2 should not be the sole criterion for evaluating the validity of a regression model. Other factors such as statistical significance of the model coefficients, assumptions of the model, and the nature of the data should also be considered. R2 should be used in conjunction with other statistical measures and validation techniques to ensure the reliability of the model.
In summary, R2 is an essential metric in regression analysis as it provides valuable information about the relationship between the independent and dependent variables. It helps in assessing the quality of the model, comparing different models, and understanding the impact of independent variables on the outcome. However, it should be used in conjunction with other measures to ensure the accuracy and validity of the regression analysis.
Read Also: Understanding Rolling Standard Deviation and How It Can Help Analyze Data
The coefficient of determination, commonly known as R-squared or R2, is a statistical measure that indicates the proportion of the variance in the dependent variable that is predictable from the independent variable(s). It provides a measure of how well the regression model fits the observed data.
To calculate R2, you need to first perform a regression analysis. This involves fitting a regression line or curve to the observed data points. The regression line is obtained by minimizing the sum of the squared differences between the observed values of the dependent variable and the predicted values from the regression equation.
Once you have obtained the regression line, you can calculate R2 using the following formula:
R2 = 1 - (SSR/SST)

Where SSR represents the sum of the squared residuals, and SST represents the total sum of squares. The sum of squared residuals is a measure of the discrepancy between the observed values and the predicted values from the regression line. The total sum of squares is a measure of the total variation in the dependent variable.
R2 ranges from 0 to 1, with higher values indicating a better fit of the regression model to the data. A value of 1 indicates that the regression line perfectly predicts the dependent variable, while a value of 0 indicates no linear relationship between the independent and dependent variables.
It is important to note that R2 only measures the strength of the linear relationship between the independent and dependent variables. It does not indicate causality or the extent to which other factors may be influencing the dependent variable. Furthermore, it should be interpreted in conjunction with other statistical measures and should not be used as the sole criterion for evaluating the quality of a regression model.
The coefficient of determination, denoted as R2, is a statistical measure that indicates how well the regression model fits the observed data. It represents the proportion of the variance in the dependent variable that can be explained by the independent variables in the regression model.
The coefficient of determination is important because it helps assess the goodness of fit of a regression model. It provides an indication of how much variability in the dependent variable can be explained by the independent variables in the model. A higher R2 value indicates a better fit of the model to the data.
The coefficient of determination is calculated by dividing the explained sum of squares (SSR) by the total sum of squares (SST) and then subtracting the result from 1. The formula is: R2 = 1 - (SSR/SST).
The coefficient of determination is interpreted as the percentage of the variance in the dependent variable that is explained by the independent variables in the regression model. For example, an R2 value of 0.75 means that 75% of the variance in the dependent variable can be attributed to the independent variables included in the model.

TradingView Options: Everything You Need to Know If you’re an options trader or are interested in exploring options trading, you may be wondering if …
Read Article
Choosing the Best Moving Average for the 1H Chart When it comes to trading, using moving averages is a popular strategy among traders and investors. …
Read Article
Understanding the workings of FX spread Foreign exchange (FX) spreads play a crucial role in the world of currency trading. For those new to the world …
Read Article
What is the Role of DGCX? The Dubai Gold and Commodities Exchange (DGCX) plays a crucial role in the global commodities market, facilitating the …
Read Article
Chinese yuan forex code In the world of foreign exchange (forex) trading, it is crucial to understand the unique identifier codes for different …
Read Article
Setting up an Alert on Moving Average Setting alerts on moving averages can be a useful tool in keeping track of market trends and potential …
Read Article


