


What does the word UYU mean? Uncover the meaning and origins of UYU
What does the word UYU mean? The word UYU may seem unfamiliar to many, but it actually has a specific meaning and origin. In this article, we will …
Read Article
When analyzing data, it can be helpful to calculate the standard deviation, which measures the amount of variation or dispersion in a dataset. However, in some cases, a single standard deviation value may not provide a complete picture of the data’s volatility. This is where the concept of rolling standard deviation comes into play.
Rolling standard deviation calculates the standard deviation of a specific window or subset of data points within a dataset. By calculating the standard deviation for each window and iterating through the dataset, you can observe how the volatility of the data changes over time.
This technique is particularly useful when analyzing time series data, where the data points are ordered and represent observations at different points in time. By applying a rolling standard deviation, you can identify trends, patterns, or anomalies in the data that may not be apparent with a single standard deviation value.
Additionally, rolling standard deviation can provide insights into the stability of a dataset. If the rolling standard deviation remains relatively constant over time, it suggests a stable and predictable dataset. On the other hand, if the rolling standard deviation fluctuates significantly, it indicates changing volatility or unpredictability in the data.
In summary, rolling standard deviation is a valuable statistical tool that allows for a more nuanced analysis of data volatility over time. By calculating the standard deviation for specific windows within a dataset, you can gain insights into trends, patterns, and stability that may go unnoticed with a single standard deviation value. Whether you are analyzing financial data, weather patterns, or any other time series data, understanding and utilizing rolling standard deviation can greatly enhance your data analysis process.
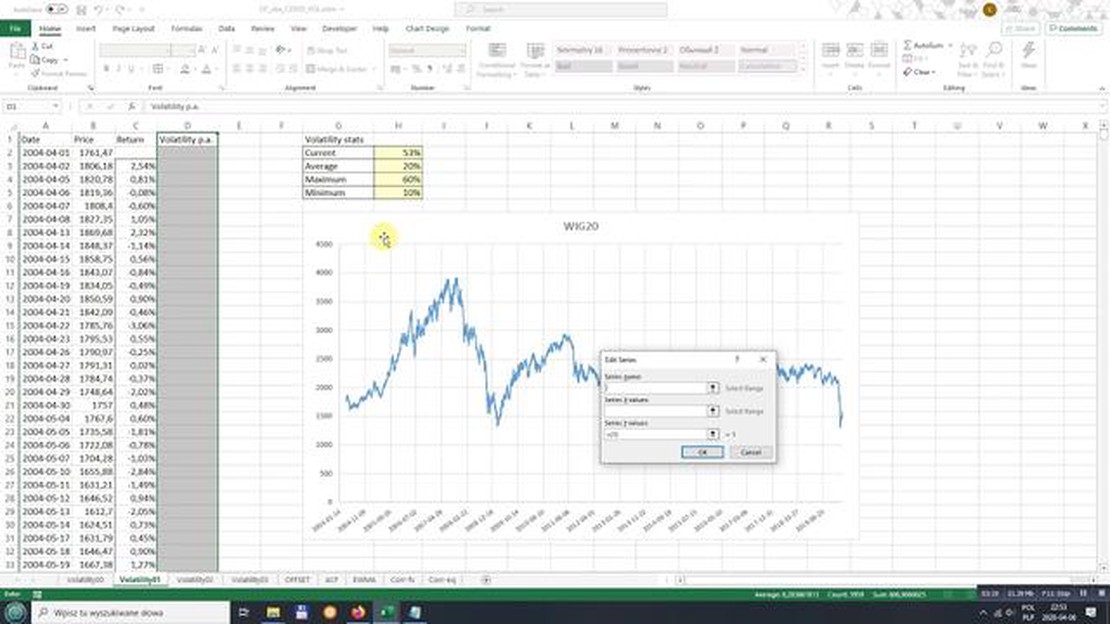
Rolling standard deviation is a statistical measure used to understand the volatility or variability of data over a specific period of time. It is commonly used in finance and economics to analyze stock market performance, risk management, and forecasting. Rolling standard deviation calculates the dispersion of data points within a moving window of a pre-defined length.
The rolling standard deviation provides insights into the stability and consistency of data by measuring how much the data deviates or varies from its average or mean value. It helps identify periods of high volatility or instability in the data, which can be useful for making informed decisions.

To calculate the rolling standard deviation, a moving window of data points is taken, and the standard deviation is calculated for each window. The window size can be adjusted based on the specific analysis requirements, such as daily, weekly, or monthly data points.
The formula to calculate the rolling standard deviation is as follows:
| Rolling Standard Deviation | = | Square root of (Sum of (Value[i] - Mean)^2 / N) |
Read Also: What is the going price for selling a Wii system?
Where:
By calculating the rolling standard deviation, analysts can gain a better understanding of the data’s behavior and make informed decisions based on the level of volatility present. It can be used as a tool to detect trends, identify outliers, and assess the potential risks and rewards associated with an investment or decision.
The rolling standard deviation is a statistical calculation that measures the amount of variation or dispersion in a set of data over a specified period of time. It is similar to the regular standard deviation, but instead of looking at the entire dataset, it focuses on subsets or “rolling windows” of the data. This allows for analysis of how the data changes over time and provides insights into trends, patterns, and volatility.
The purpose of using rolling standard deviation is to understand the volatility and variability of data over time. It is commonly used in financial analysis to measure risk and identify potential investment opportunities. By calculating the rolling standard deviation, analysts can assess the stability of financial instruments, such as stocks or bonds, and make informed decisions based on the level of risk associated with them.
In addition to finance, the rolling standard deviation can also be applied in other fields, such as manufacturing, healthcare, and climate science. For example, in manufacturing, it can be used to monitor the quality of products or processes over time. In healthcare, it can help identify trends in patient outcomes or the effectiveness of treatments. In climate science, it can be used to analyze weather patterns and predict future climate changes.
Overall, the rolling standard deviation is a valuable statistical tool that provides a dynamic and time-sensitive analysis of data. It enhances understanding of patterns, trends, and volatility, making it a valuable tool for decision-making and forecasting in various industries.
To calculate the rolling standard deviation, you need a set of data points and a specified window size. The window size refers to the number of data points to include in each calculation of the standard deviation.
Here are the steps to calculate the rolling standard deviation:
Read Also: How to trade gold and oil in forex: A beginner's guide
By using rolling standard deviation, you can analyze how the variability of data changes as new data points are added and the window moves forward. This can be particularly useful when working with time series data or when trying to spot trends or patterns in your data over a certain time period.
Rolling standard deviation is a statistical measure that calculates the variability of a data set over a specified time period. It involves calculating the standard deviation for a series of overlapping sub-intervals within the data set.
Rolling standard deviation is useful in data analysis as it helps identify trends and patterns in the data over time. It can provide insights into the volatility and risk associated with the data set, and it can be used to compare the variability of different data sets.

Sure! Let’s say we have a daily stock price data set for the past 30 days. To calculate the rolling standard deviation for a 10-day interval, we would first calculate the standard deviation for the first 10 days, then move the window one day forward and calculate the standard deviation for the next 10 days. We repeat this process until we reach the end of the data set.
The main difference between rolling standard deviation and simple standard deviation is that rolling standard deviation calculates the standard deviation over a moving window, while simple standard deviation calculates the standard deviation for the entire data set. Rolling standard deviation provides a more dynamic view of the data and can capture changes in variability over time.
One limitation of using rolling standard deviation is that it can be sensitive to the window size chosen. A smaller window size may provide a more detailed view of short-term fluctuations, but may not capture long-term trends. On the other hand, a larger window size may smooth out short-term fluctuations, but may hide important changes in the data. It’s important to choose the window size carefully based on the specific data and analysis objectives.
Rolling standard deviation is a statistical measure that calculates the standard deviation of a specific data set by including a certain number of data points within a rolling window. It is often used in financial analysis and time series data analysis to understand the volatility or variability of a data series over time.
Rolling standard deviation differs from regular standard deviation in that it calculates the standard deviation for a subset of data points within a rolling window, rather than considering the entire data set. This allows for a more dynamic analysis of changes in volatility over time, as the rolling window moves along the data series.

What does the word UYU mean? The word UYU may seem unfamiliar to many, but it actually has a specific meaning and origin. In this article, we will …
Read Article
Understanding HTF in Forex Trading When it comes to trading in the Forex market, understanding higher time frames (HTF) is essential for making …
Read Article
Understanding the Capital Forex Market The global foreign exchange (forex) market, also known as the Capital Forex Market, is the most liquid and …
Read Article
Understanding the Meaning of Wick on the Chart When analyzing financial charts, it is crucial to understand the meaning behind the various components …
Read Article
Why am I Losing in Forex? Forex, also known as foreign exchange, can be a highly profitable market for those who know how to navigate it successfully. …
Read Article
Is Forex Legal: Understanding the Legality of Forex Trading Forex trading, also known as foreign exchange trading, has gained immense popularity in …
Read Article


