

What is FX Journal? A Comprehensive Guide to Forex Trading Journals
What is FX journal? When it comes to forex trading, keeping track of your trades and analyzing your performance is crucial for improving your …
Read Article

When it comes to trading, understanding chart patterns can be crucial for making informed decisions and identifying potential opportunities. One such pattern that traders often look for is the Cypher Pattern. A Cypher Pattern is a harmonic trading pattern that can provide valuable insights into future price movements.
The Cypher Pattern is a four-legged pattern that follows specific Fibonacci ratios. It consists of a sharp initial move in price, followed by a retracement and then a continuation in the original direction. Traders use this pattern to identify potential entry and exit points in the market.
To spot a Cypher Pattern, traders typically look for specific price movements and ratios. The pattern starts with an XA leg, which is the initial move in price. This leg should be relatively sharp and can be either an uptrend or a downtrend. The next leg is the AB leg, which is a retracement of the initial move. Traders look for this leg to retrace between 38.2% and 61.8% of the XA leg.
The BC leg is the second retracement in the pattern and should ideally retrace 38.2% to 88.6% of the AB leg. Finally, the CD leg is the last leg of the pattern and should be an extension of the AB leg. Traders will look for the CD leg to reach 127.2% to 141.4% of the BC leg. When these specific ratios are met, it indicates the completion of the Cypher Pattern.
Identifying a Cypher Pattern requires a keen eye for detail and an understanding of Fibonacci ratios. Traders can use charting software and tools to help them identify and draw the pattern on their charts. By recognizing the Cypher Pattern, traders can potentially benefit from accurate entry and exit points, increasing their chances of success in the market.
The cypher pattern is a harmonic trading pattern that can help traders identify potential reversal zones in the market. It is based on Fibonacci levels and geometric shapes.
The cypher pattern is formed by a series of price swings, with certain ratios between the swings. These ratios are derived from the Fibonacci sequence, which is a mathematical sequence that has found applications in various fields, including trading.
In a cypher pattern, there are specific rules that define the shape and structure of the pattern. These rules include the following:

Once the cypher pattern is formed, traders can use it to identify potential reversal zones, where they can enter trades with favorable risk-reward ratios. They can also use other technical indicators and tools to confirm the validity of the pattern and make more informed trading decisions.
It is important to note that not all cypher patterns will result in successful trades. Traders should always consider other factors, such as market conditions and trend analysis, before making trading decisions based on the cypher pattern.
In conclusion, understanding the basics of the cypher pattern can be a valuable tool for traders looking to identify potential reversal zones in the market. By following the rules and guidelines of the pattern, traders can improve their chances of making profitable trades and managing their risk effectively.
The Cypher pattern is a popular harmonic trading pattern that can be used to identify potential reversals in price direction. It is characterized by several key features:
Read Also: Discovering the Legitimacy of OFX: What You Need to Know
It is important to note that not all patterns that resemble a Cypher pattern will follow the exact Fibonacci ratios described above. However, by understanding the key characteristics of the Cypher pattern, traders can effectively identify potential trading opportunities and make informed decisions.
The Cypher pattern is a popular chart pattern used by traders in technical analysis to identify potential entry points in the market. It is a harmonic pattern that provides traders with a high-probability trading opportunity.
Read Also: Is FBS available for use in the USA?
To identify the Cypher pattern, traders should follow the following steps:
After identifying the Cypher pattern, traders can proceed to trade it by following these steps:
Traders should also take into consideration other factors such as market trends, news events, and risk management strategies when trading the Cypher pattern.
In conclusion, the Cypher pattern is a powerful tool for identifying and trading potential reversal points in the market. By understanding how to identify and trade this pattern, traders can increase their chances of success in the financial markets.

A cypher pattern in trading is a harmonic trading pattern that predicts potential reversals in price movement. It is identified by specific Fibonacci ratios and geometric shapes.
You can spot a cypher pattern in trading by looking for specific price swings that conform to the Fibonacci ratios of 0.382 or 0.618. These swings form specific geometric shapes, such as a “W” or an “M” pattern, which indicate the presence of a cypher pattern.
The key Fibonacci ratios used in identifying a cypher pattern are 0.382 and 0.618. These ratios represent the potential retracement levels of the price movement.
A cypher pattern can provide a potential indication of a price reversal, but it is not a guaranteed prediction. It is important to use other technical indicators and analyze market conditions before making trading decisions based solely on a cypher pattern.
No, cypher patterns can be applied to various financial markets, including stocks, forex, and commodities. The key is to identify the specific swings and Fibonacci ratios that form the pattern, regardless of the market being traded.
A cypher pattern is a type of harmonic trading pattern that can help traders identify potential trend reversals in the market. It consists of four price swings and specific Fibonacci ratios, and it is named after the letter “M” or “W” shape it forms on the price chart.

What is FX journal? When it comes to forex trading, keeping track of your trades and analyzing your performance is crucial for improving your …
Read Article
Impact of September 11, 2001 Attacks on the Stock Market The stock market crash that occurred on September 11, 2001, sent shockwaves around the world …
Read Article
Is Falcon software free? Are you considering using Falcon software for your business, but unsure about the price? Look no further, as we break down …
Read Article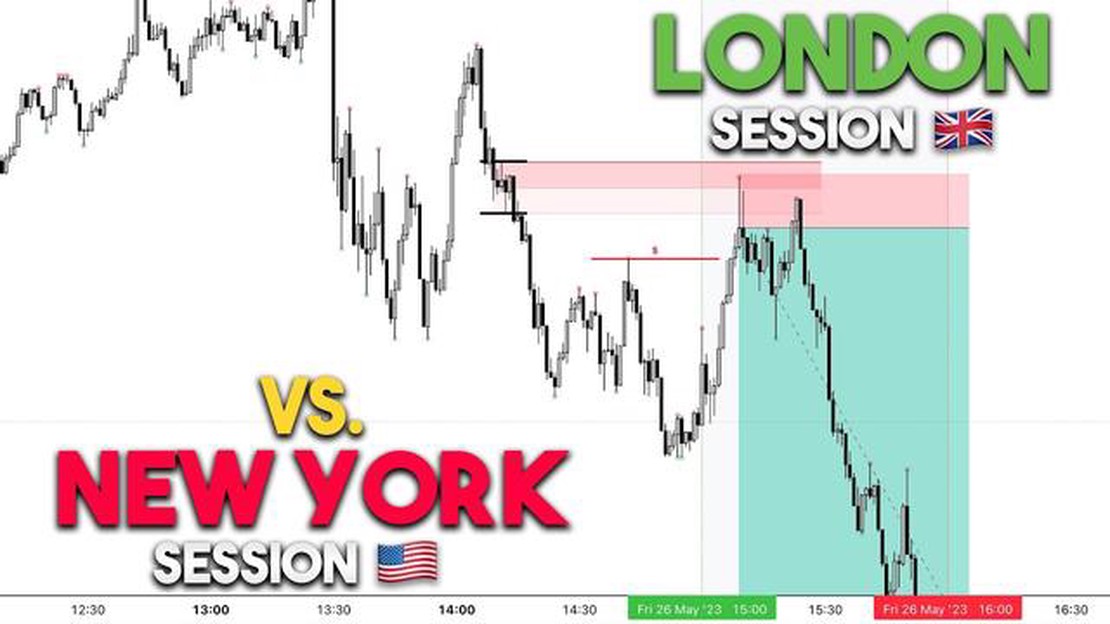
Is London Session More Volatile Than New York? Forex market trading sessions play a crucial role in determining the overall volatility of currency …
Read Article
Reasons behind the decline of MSN usage MSN, which was once one of the leading messaging platforms, has seen a significant decline in its user base …
Read Article
Best Platforms for 100x Leverage Trading When it comes to trading cryptocurrencies and other assets, leverage can be a powerful tool that allows …
Read Article


