


Understanding the Significance of Magic Numbers in EA Forex Trading
Understanding the Concept of Magic Number in EA Forex Trading Electronic trading has revolutionized the foreign exchange market, making it faster and …
Read Article
When it comes to technical analysis, chart patterns play a crucial role in predicting future price movements. One of the most popular chart patterns is the ABC pattern, which is valued by traders and investors for its reliability and accuracy.
The ABC pattern is a three-wave pattern that can be observed in both bullish and bearish markets. It consists of an initial trend wave (A), a correction wave (B), and a final trend wave (C). By understanding how the ABC pattern works, traders can identify potential entry and exit points, as well as anticipate trend reversals.
The A wave is the initial trend wave, where the price moves in the direction of the prevailing trend. This wave represents the first impulse of buying or selling pressure. The B wave is the correction wave, where the price retraces part of the initial move. This wave is often seen as a temporary counter-trend movement before the trend continues. The C wave is the final trend wave, where the price resumes in the direction of the initial trend but with greater momentum.
Traders use various tools and indicators to confirm the validity of the ABC pattern, such as Fibonacci retracements, trendlines, and volume analysis. These tools help identify potential support and resistance levels, measure the extent of the correction wave, and gauge the strength of the trend continuation.
In this comprehensive guide, we will delve deeper into the ABC chart pattern, exploring its characteristics, variations, and practical applications. By the end, you will have a solid understanding of this powerful chart pattern and be able to incorporate it into your trading strategy.
The ABC Chart Pattern is a popular technical analysis tool used by traders to identify potential price trends in the financial markets. It is a visual representation of the market movements and is often used in conjunction with other technical indicators to make informed trading decisions.
The pattern consists of three key components – the A, B, and C points. The A point represents the start of a trend, the B point represents a correction or retracement, and the C point represents the continuation of the initial trend.
In an upward or bullish ABC chart pattern, the A point is the lowest low, the B point is a higher low, and the C point is an even higher low. This indicates that buyers are stepping in at each correction, pushing the price higher and confirming the bullish trend.

In a downward or bearish ABC chart pattern, the A point is the highest high, the B point is a lower high, and the C point is an even lower high. This indicates that sellers are stepping in at each retracement, pushing the price lower and confirming the bearish trend.
Traders use the ABC chart pattern to anticipate potential price targets and entry/exit points. By identifying the A, B, and C points, traders can estimate the length and strength of the trend, which can help them formulate a trading strategy.
It is important to note that the ABC chart pattern is not a foolproof method and should be used in conjunction with other technical analysis tools and fundamental analysis. Additionally, it is crucial to practice risk management and set stop-loss orders to protect against potential losses.
The ABC chart pattern is a popular and powerful technical analysis tool used by traders to identify potential trend reversals and continuation patterns in the financial markets. This pattern consists of three distinct legs, labeled as A, B, and C, and is formed by price movements.
Read Also: Understanding the factors causing the weakness of AUD against Euro
The significance of the ABC chart pattern lies in its ability to provide traders with valuable insights into market trends and potential trading opportunities. By identifying and analyzing the ABC pattern, traders can make more informed decisions about when to enter or exit trades.
One of the key features of the ABC chart pattern is its ability to indicate potential trend reversals. When the pattern is properly identified and confirmed, it can signal that the current trend is likely to change direction. This can be useful for traders looking to take advantage of market reversals and profit from changing price movements.
In addition to trend reversals, the ABC chart pattern can also indicate potential trend continuation patterns. This means that after the completion of the ABC pattern, the price is likely to continue moving in the same direction as before. By recognizing these continuation patterns, traders can stay aligned with the prevailing trend and capitalize on potential trading opportunities.
It is important to note that the ABC chart pattern is not a guaranteed indicator of future price movements. However, when combined with other technical analysis tools and used in conjunction with proper risk management strategies, it can be a valuable tool for traders to enhance their trading decisions.
Read Also: What is the Average GBP to Euro Exchange Rate over the Last 10 Years?
Overall, the significance of the ABC chart pattern lies in its ability to provide traders with insights into potential trend reversals and continuation patterns. By properly identifying and analyzing this pattern, traders can make more informed decisions and increase their chances of success in the financial markets.
The ABC chart pattern is a common technical analysis pattern that can provide traders with valuable information about potential trend reversals and continuation patterns. It is important to understand how to identify and trade the ABC chart pattern in order to make informed trading decisions.
Identifying the ABC Chart Pattern:
Trading the ABC Chart Pattern:

By understanding how to identify and trade the ABC chart pattern, traders can gain an edge in the market and make more informed trading decisions. It is important to practice and refine your skills in identifying and trading this pattern through backtesting and demo trading before applying it to live trading.
An ABC chart pattern is a technical analysis tool used to identify and predict patterns in stock or commodity prices. It consists of three distinct price swings: an initial move in one direction, a retracement in the opposite direction, and then a final move in the same direction as the initial move.
To spot an ABC chart pattern, you need to look for three distinct price swings on a price chart. The first swing represents the initial move, the second swing represents the retracement, and the third swing represents the final move. These swings should form a distinct pattern that resembles the letter “A”, “B”, and “C”.
The significance of the ABC chart pattern is that it can help traders and investors identify potential reversal or continuation patterns in price movements. By understanding and recognizing this pattern, traders can make more informed decisions about when to enter or exit a trade.
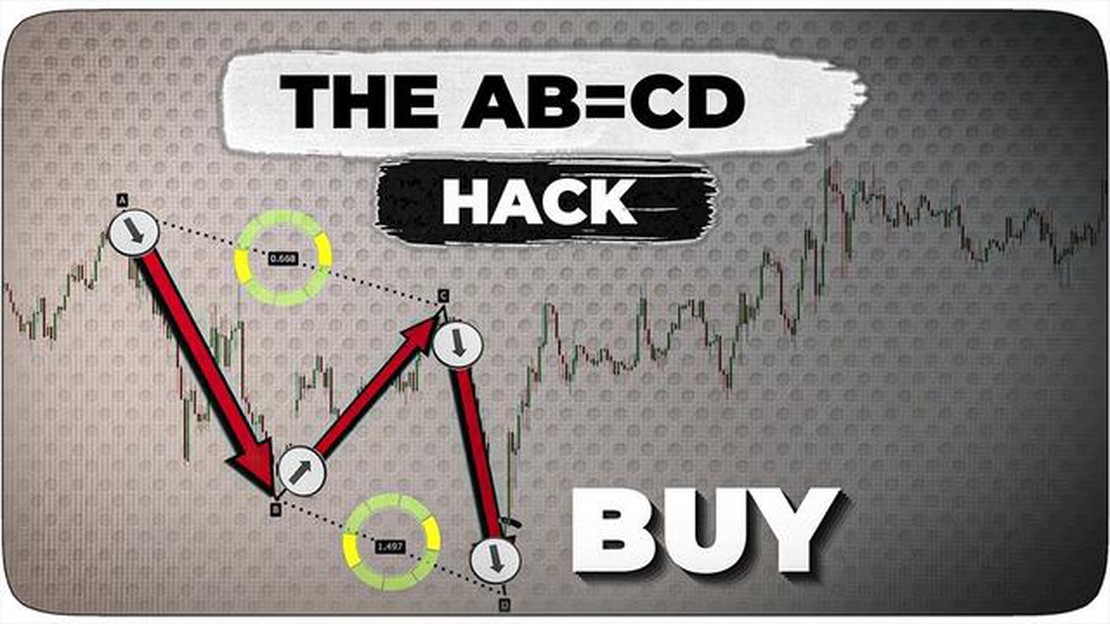
Yes, there are variations of the ABC chart pattern, such as the ABCD pattern and the AB=CD pattern. These variations incorporate additional price swings and Fibonacci retracement levels, providing traders with more detailed information about potential price movements.
You can use the ABC chart pattern in your trading strategy by identifying and confirming the pattern on a price chart, then using it to determine entry and exit points for your trades. This can be done by placing buy or sell orders at key levels, such as the completion of the pattern or the breakout from the pattern.

Understanding the Concept of Magic Number in EA Forex Trading Electronic trading has revolutionized the foreign exchange market, making it faster and …
Read Article
How do I report F&F income on my tax return? If you are an F& user and have encountered any issues or difficulties while using the platform, it is …
Read Article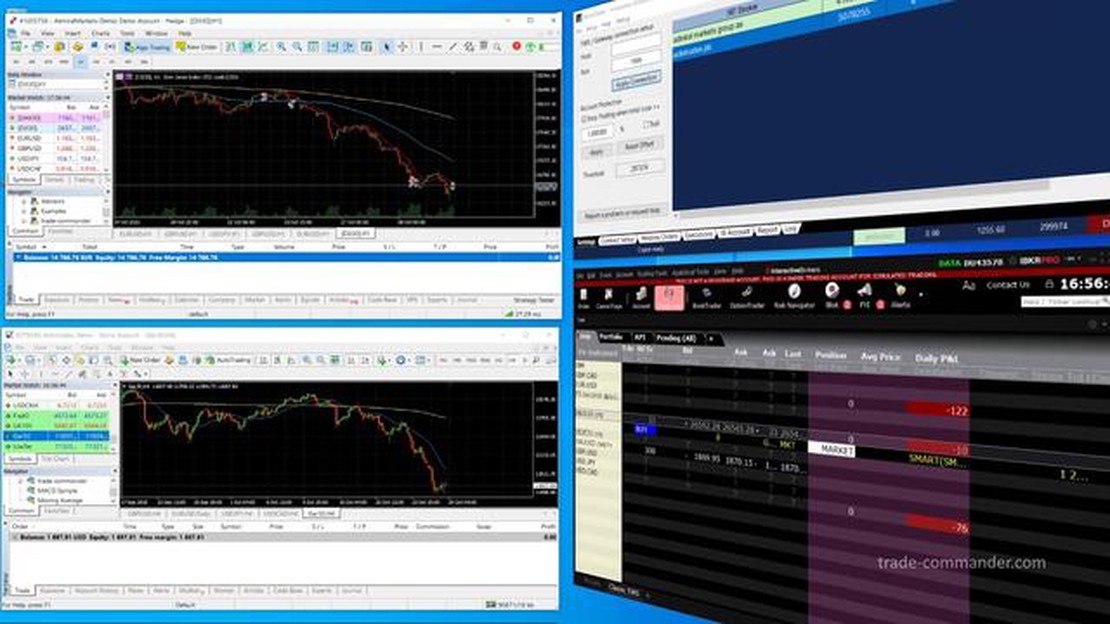
Can I use mt4 with Interactive Brokers? If you are a trader in the financial markets, you are likely familiar with MetaTrader 4 (MT4), one of the most …
Read Article
Understanding the mechanics of phantom stock Phantom stock is an increasingly popular form of compensation that many companies are utilizing today. It …
Read Article
Tips and strategies to avoid losses on the forex market Forex trading can be a highly profitable venture, but it is not without its risks. Many new …
Read Article
Best Brokerages for Option Trading If you are interested in trading options, finding the right brokerage can make all the difference. With so many …
Read Article


