


Is Forex Trading Legal in Canada? Everything You Need to Know
Is forex trading legal in Canada? Forex trading, the process of buying and selling currencies, is a popular investment option for many individuals and …
Read Article
Renko charts have gained popularity among traders for their ability to filter out market noise and provide a clear visual representation of price movements. But just how accurate are Renko charts? This article explores the reliability of Renko charting as a tool for making trading decisions.
Renko charts are constructed by plotting bricks or boxes that represent a fixed price movement, rather than time intervals. Each brick is based on a predetermined price range, such as $1 or 10 pips. This unique construction eliminates the noise caused by smaller price fluctuations and focuses on significant price movements.
Many traders claim that Renko charts offer a more accurate depiction of price action compared to traditional candlestick or bar charts. By removing the time element and focusing solely on price movements, Renko charts provide a clearer picture of market trends and help traders identify key support and resistance levels.
However, it is important to note that Renko charts may not be suitable for all market conditions. In highly volatile markets, the fixed price range used to construct Renko bricks may result in fewer bricks being formed, leading to a loss of detail and potentially missing important price patterns.
Key takeaway: While Renko charts are known for their ability to filter out noise and provide a clear visualization of price movements, their accuracy may vary depending on market conditions. Traders should consider using Renko charts in combination with other technical analysis tools to ensure a comprehensive assessment of the market before making trading decisions.

Renko charts are a type of technical analysis tool that focuses on the price movement of an asset. Unlike traditional candlestick or bar charts, Renko charts disregard the time element and only focus on price changes. Instead of using a uniform time frame, Renko charts use bricks or boxes to represent price movements. These bricks are drawn one after another, creating a clear visual representation of the price action.
The construction of a Renko chart is based on a specific price movement threshold, also known as the brick size. This threshold can be set to a fixed value, such as a certain number of points or pips, or it can be based on a percentage change in price. When the price exceeds the brick size, a new brick is added to the chart in the direction of the price movement. If the price does not move enough to trigger a brick, no changes are made to the chart.
Read Also: Option Repricing: An Example to Understand Its Mechanics
Renko charts are particularly useful for identifying trends and reversals in the market. Since they filter out noise and focus only on significant price movements, Renko charts can provide a clearer and more accurate picture of the market’s direction. Traders can easily spot patterns, support and resistance levels, and trend lines on Renko charts, making it easier to make informed trading decisions.
While Renko charts offer many advantages, it is important to note that they may not be suitable for all trading strategies. Since Renko charts do not consider time, they may not be ideal for traders who rely heavily on time-based indicators or signals. Additionally, Renko charts may not be as effective in choppy or volatile markets, where small price movements may trigger frequent brick changes.
In conclusion, understanding Renko charts is crucial for traders who want to incorporate this unique charting technique into their technical analysis. By focusing solely on price movements and disregarding time, Renko charts can provide a clearer and more accurate representation of the market’s direction. However, traders should be aware of the limitations of Renko charts and consider their suitability for their specific trading strategies.
Renko charts have gained popularity among traders due to their unique representation of price action and potential for providing reliable signals. However, it is important to examine the accuracy of Renko charts to determine their reliability as a trading tool.
One key aspect to consider when evaluating the accuracy of Renko charts is their ability to filter out noise and highlight significant price movements. Renko charts are constructed based on fixed price increments, disregarding time and only focusing on price action. This feature allows Renko charts to smoothen out price fluctuations and provide a clearer picture of the underlying trend.
Another factor to consider is the accuracy of Renko chart signals. These signals are generated based on the formation of new bricks, which are determined by the predefined price increment. The formation of a new brick signifies a change in the underlying trend, providing traders with potential entry or exit points. By following the signals generated by Renko charts, traders can potentially capitalize on significant price movements.
To evaluate the accuracy of Renko charts, traders can compare the signals generated by Renko charts with signals generated by other technical indicators or chart types. By comparing the consistency and accuracy of these signals, traders can determine the effectiveness of Renko charts in their trading strategies. It is important to note that no trading tool is 100% accurate, and traders should consider using Renko charts in conjunction with other tools and analysis techniques.
Additionally, it is crucial for traders to understand the limitations and potential drawbacks of Renko charts. Renko charts may not accurately represent rapid price movements or periods of low liquidity, as they are based solely on price action and disregard time. Furthermore, Renko charts may not be suitable for all trading styles or market conditions, and traders should conduct thorough testing and analysis to determine their effectiveness in specific scenarios.
Read Also: How Charts Are Used for Quality Control
| Pros of Renko Charts | Cons of Renko Charts |
|---|---|
| Filter out noise and highlight significant price movements | May not accurately represent rapid price movements |
| Provide clear trend analysis | May not accurately represent periods of low liquidity |
| Generate signals for potential entry or exit points | May not be suitable for all trading styles or market conditions |
In conclusion, Renko charts can be a valuable tool for traders in analyzing trends and identifying potential trading opportunities. However, it is essential to examine the accuracy of Renko charts by comparing them with other indicators and conducting thorough testing. Traders should also be aware of the limitations and potential drawbacks of Renko charts and consider using them in conjunction with other tools to enhance their trading strategies.

Renko charts are a type of financial chart used in technical analysis to track the price movement of an asset. They are created by plotting bricks or blocks of a fixed size on a chart, regardless of the time interval. Each brick represents a specific price range. Renko charts remove the noise and emphasize the significant price movements. They work by filtering out small price fluctuations and focusing on the directional movement of the price.
Rather than focusing on accuracy, Renko charts offer a different perspective on price movements compared to traditional candlestick charts. Renko charts help traders identify trends and potential reversals more clearly by removing the noise caused by small price fluctuations. However, it’s important to note that no charting method is 100% accurate, and the effectiveness of Renko charts will depend on the individual trader’s strategy and the market conditions.
There are several advantages to using Renko charts. Firstly, they help traders identify trends more easily by filtering out noise and focusing on significant price movements. Secondly, Renko charts can provide clearer entry and exit signals, as they remove the ambiguity of traditional candlestick charts. Additionally, Renko charts can be used on any market or asset class, and they can help traders eliminate emotional decision-making by focusing solely on price action.
While Renko charts can be a valuable tool in technical analysis, they do have certain limitations. One of the main drawbacks is that Renko charts do not provide time-based information, which can make it difficult to analyze the speed and duration of price movements. Additionally, Renko charts may not be suitable for all trading strategies or market conditions, and traders should consider using them in conjunction with other analysis tools to gain a more comprehensive view of the market.

Is forex trading legal in Canada? Forex trading, the process of buying and selling currencies, is a popular investment option for many individuals and …
Read Article
Is HDFC a good choice for international transactions? When it comes to international transactions, choosing the right bank is of utmost importance. …
Read Article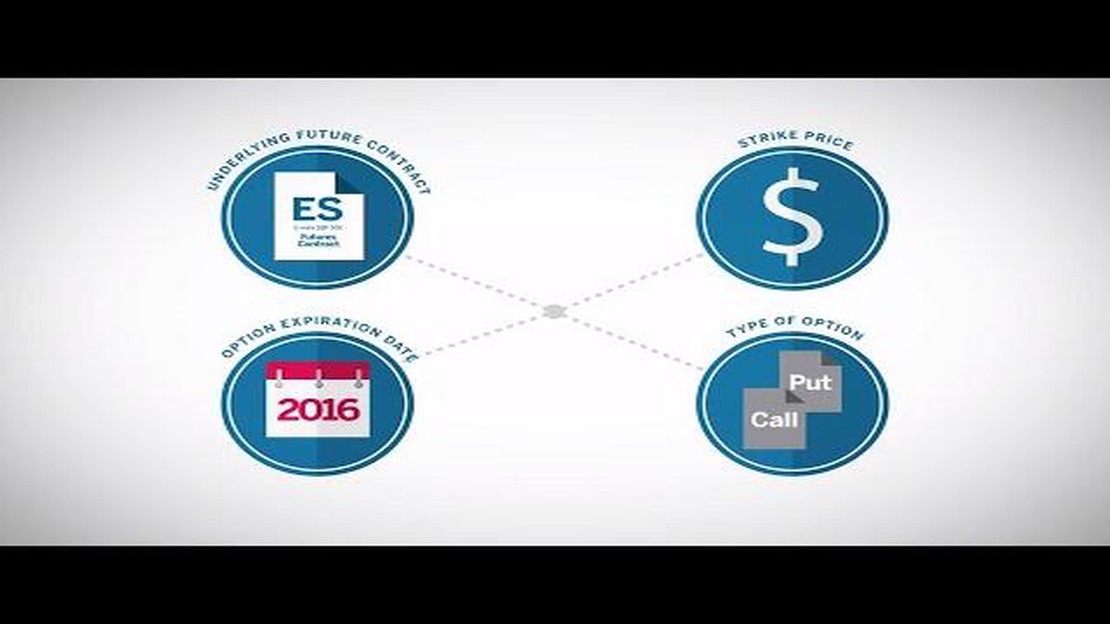
What Are the Advantages of Using Options on Futures Contracts? Options on futures contracts are derivative contracts that give investors the right, …
Read Article
Reasons Companies Grant Stock Options Stock options are a form of compensation that many companies offer to their employees. It is a popular incentive …
Read Article
Step-by-Step Guide: How to Install EA in MT4 Welcome to our step-by-step guide on how to install an Expert Advisor (EA) in MT4! If you’re new to the …
Read Article
Understanding MQL in Forex Trading Forex, or foreign exchange, is a decentralized global market where participants exchange one currency for another. …
Read Article


