


The Impact of Financial Derivatives in Emerging Markets
Financial Derivatives in Emerging Markets: A Comprehensive Analysis Financial derivatives have become a crucial component of the global financial …
Read Article
Are you interested in trading Forex and looking for a reliable strategy to help you make better trading decisions? Look no further, as this beginner’s guide will introduce you to Bollinger Bands, a powerful tool used by many successful traders.
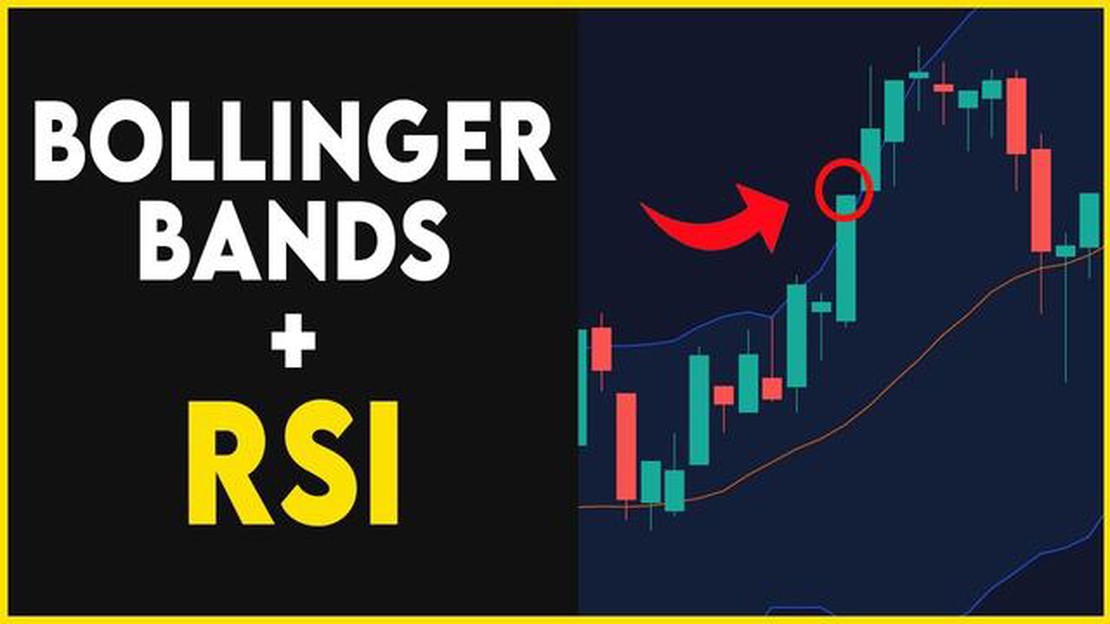
Bollinger Bands are a technical analysis tool created by John Bollinger. They consist of a simple moving average and two standard deviation bands, which dynamically adjust according to market volatility. This means that as volatility increases, the bands widen, and as volatility decreases, the bands contract.
So, how can you use Bollinger Bands to improve your trading? Bollinger Bands can help you identify overbought and oversold levels and determine potential trend reversals. When the price is near the upper band, it may indicate that the market is overbought and due for a correction. On the other hand, when the price is near the lower band, it may suggest that the market is oversold and due for a bounce.
Furthermore, Bollinger Bands can also help you identify a breakout or a continuation of a trend. When the price is trading within the bands, it indicates a consolidation phase. However, when the price breaks above or below the bands, it suggests a potential breakout or continuation of the trend.
While Bollinger Bands can be a valuable tool in your trading arsenal, it’s important to note that they should be used in conjunction with other technical indicators and tools to make well-informed trading decisions. Like any trading strategy, it’s important to backtest and practice using Bollinger Bands before implementing them in your live trading.
In this beginner’s guide, we will walk you through step-by-step on how to set up Bollinger Bands on your trading platform, interpret the signals they provide, and develop a trading strategy using Bollinger Bands. So, buckle up and get ready to learn how to trade Bollinger Bands in Forex!
Bollinger Bands is a popular technical analysis tool used by traders to identify price levels that are overbought or oversold. Developed by John Bollinger in the 1980s, this indicator is based on the concept of volatility and consists of three lines plotted on a price chart.
The middle line of the Bollinger Bands is a simple moving average (SMA), typically set to a 20-day period, which represents the average price over the chosen time frame. The upper and lower bands are calculated by adding and subtracting a certain number of standard deviations from the middle line.
The standard deviation is a measure of price volatility, and the number of standard deviations used depends on the trader’s preference. Typically, a value of two standard deviations is used, resulting in the upper and lower bands being located two standard deviations away from the SMA.

Bollinger Bands can also be used to identify trends and determine the strength of the current market conditions. When the bands are expanding, it indicates high volatility, while contracting bands suggest low volatility.
Traders often use Bollinger Bands in conjunction with other technical indicators to confirm trading signals. For example, a trader may look for a price reversal near the upper band and wait for a confirmation from an oscillator or a trend-following indicator before entering a trade.
It’s important to note that Bollinger Bands alone should not be relied upon for making trading decisions. They are most effective when used in combination with other tools and indicators to form a comprehensive trading strategy.
Read Also: Understanding the Volatility of Forex Pairs: A Comprehensive Guide
By understanding the basics of Bollinger Bands, traders can incorporate this powerful tool into their forex trading strategy and make more informed trading decisions.
When it comes to trading with Bollinger Bands in Forex, it is important to understand the key components that make up this popular technical indicator.
The Bollinger Bands consist of three main components:
These three components work together to provide traders with valuable information about potential market trends and price volatility.
In addition to the three main components, Bollinger Bands also include the concept of standard deviation. Standard deviation measures the dispersion or volatility of the price around the moving average. The wider the bands, the higher the volatility, and vice versa.
Traders often use Bollinger Bands to identify periods of low volatility, known as squeeze, followed by periods of high volatility. This can help them anticipate potential breakouts or trend reversals.
Understanding each component of the Bollinger Bands is crucial for successful trading. By analyzing the upper and lower bands, traders can determine overbought and oversold levels, while the middle band provides information about the prevailing trend and potential support or resistance levels.
With a clear understanding of the key components, traders can confidently incorporate Bollinger Bands into their Forex trading strategies, improving their chances of making profitable trades.
Read Also: Does Warren Buffett invest in silver? Find out here
The Bollinger Band Squeeze is a technical analysis pattern that occurs when the Bollinger Bands contract, indicating a period of low volatility and potential upcoming price volatility. Traders often use this pattern to anticipate a breakout in the market.
During a Bollinger Band Squeeze, the upper and lower Bollinger Bands narrow, showing a decrease in price volatility. This contraction suggests that the market is in a consolidation phase, with buyers and sellers reaching an equilibrium. As the price range becomes tighter, it indicates a potential strong price move in the near future.
Traders look for a Bollinger Band Squeeze as an early signal of an impending volatility expansion. It provides an opportunity to position themselves before a breakout occurs. When the Bollinger Bands start expanding again, it suggests that the market is breaking out of the consolidation phase and entering a period of increased volatility.

The Bollinger Band Squeeze can be interpreted in different ways depending on a trader’s strategy. Some may interpret it as a signal to buy when the upper band breaks above the resistance level or sell when the lower band breaks below the support level. Others may wait for a confirmation after the breakout occurs and use the Bollinger Bands as a trailing stop loss.
It’s important to note that the Bollinger Band Squeeze is not a guaranteed indicator of a breakout. Sometimes, the contraction in volatility may continue for an extended period before a breakout occurs, or the breakout may not happen at all. Therefore, it’s crucial to use additional technical tools and indicators to confirm the signals provided by the Bollinger Bands.
Overall, the Bollinger Band Squeeze is a valuable tool for traders to identify potential trading opportunities. By understanding the pattern and its interpretation, traders can utilize it in their trading strategies to capitalize on periods of low volatility and anticipate future price movements.
Bollinger Bands are a highly popular technical analysis tool in forex trading. They consist of a simple moving average (SMA) in the middle, and an upper and lower band that are two standard deviations away from the SMA. The bands provide a visual representation of the price volatility and can be used to identify overbought or oversold conditions.
Bollinger Bands work by measuring the price volatility and identifying potential trading opportunities. When the price is closer to the upper band, it is considered overbought, and when it is closer to the lower band, it is considered oversold. Traders can use these indications to enter or exit trades. Additionally, when the price breaks out of the bands, it may signal a significant price move.
Bollinger Bands are considered a valuable tool in technical analysis, but like any indicator, they are not foolproof. It is important to use Bollinger Bands in conjunction with other indicators or analysis techniques to confirm signals. Traders should also consider market conditions and use proper risk management strategies. With proper usage and understanding, Bollinger Bands can be a reliable tool in forex trading.
Bollinger Bands are a technical analysis tool that consists of a moving average line and two standard deviation lines. They are used to identify price volatility and potential price reversals.

Financial Derivatives in Emerging Markets: A Comprehensive Analysis Financial derivatives have become a crucial component of the global financial …
Read Article
Which country has the lowest currency? In the world of currency exchange rates, there are many countries that have a low valuation for their currency. …
Read Article
Prospects for Euro Appreciation against CHF The euro has been facing considerable challenges in its struggle to strengthen against the Swiss franc …
Read Article
Top Competitors of FXCM Forex Capital Markets (FXCM) is one of the leading brokerage firms in the forex trading industry, providing access to over 40 …
Read Article
Guide to Trading on the Saudi Exchange: Step-by-Step Instructions Welcome to the ultimate guide to trading in the Saudi Exchange! If you are …
Read Article
What is the moving average model in econometrics? In the field of econometrics, the moving average model is a key tool for analyzing and forecasting …
Read Article


