
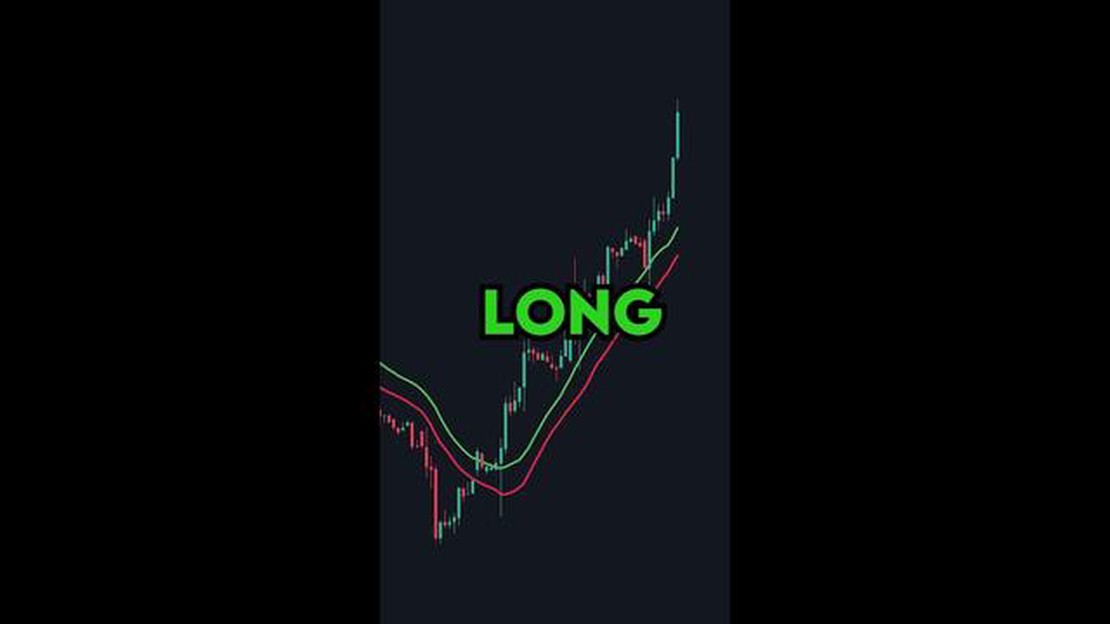

Which moving average is most effective for the 1-hour chart?
Choosing the Best Moving Average for the 1H Chart When it comes to trading, using moving averages is a popular strategy among traders and investors. …
Read Article
Investors and traders have long used various technical indicators to help them make informed decisions in the financial markets. One of the most widely followed indicators is the 200-day moving average (MA). The 200-day MA is a simple yet powerful tool that can provide valuable insights into the overall trend of a security.
The 200-day MA is calculated by adding up the closing prices for the past 200 trading days and then dividing that total by 200. This creates a line on a chart that smooths out short-term fluctuations and provides a visual representation of the long-term trend. As a result, the 200-day MA is often used to identify the direction of the market and to determine if a security is in an uptrend or a downtrend.
Traders often use the 200-day MA as a support or resistance level. When a security is trading above its 200-day MA, it is considered to be in an uptrend and the 200-day MA can act as a support level, indicating that buying pressure is strong. Conversely, when a security is trading below its 200-day MA, it is considered to be in a downtrend and the 200-day MA can act as a resistance level, indicating that selling pressure is strong.
The significance of the 200-day MA lies in its ability to capture the long-term trend of a security. By analyzing the relationship between the security’s current price and its 200-day MA, traders can gain insights into the overall strength or weakness of the security. This information can be used to make more informed trading decisions and to identify potential entry or exit points.
The 200-day moving average is a commonly used technical analysis tool that helps traders and investors identify trends and potential trading opportunities in financial markets. It is calculated by taking the average closing price of a security over the past 200 trading days and plotting it on a chart.
This moving average is often considered a significant indicator because it smoothes out short-term price fluctuations and provides a clearer picture of the underlying trend. By using a longer time frame, the 200-day moving average helps filter out daily noise and provides a more reliable indication of a stock or index’s overall direction.
Traders and investors use the 200-day moving average in different ways. Some consider the price crossing above the 200-day moving average as a bullish signal, indicating potential upward momentum. Conversely, a price crossing below the 200-day moving average may be seen as a bearish signal, suggesting a potential downward trend.
Additionally, the 200-day moving average can act as a support or resistance level. When a security’s price approaches the 200-day moving average from below, it may find support and bounce off, potentially leading to a reversal in the trend. Conversely, when the price approaches the 200-day moving average from above, it may encounter resistance and reverse its upward trend.

It’s important to note that the 200-day moving average is just one tool among many used in technical analysis. Like any indicator, it has its limitations and should be used in conjunction with other analysis techniques and indicators to make informed trading decisions.
Read Also: Is IQ Option legit and safe? Get the facts here!
Summary:
The 200-day moving average is a technical analysis tool used to identify trends and potential trading opportunities. It smoothes out short-term price fluctuations and provides a clearer picture of the underlying trend. It can be used as a support or resistance level, and its crossing by the price can be seen as potential bullish or bearish signals. However, it should be used alongside other analysis techniques for better accuracy.
A moving average is a commonly used technical indicator in financial markets that helps smooth out price data and identify trends over a certain period of time. It is a mathematical calculation that represents the average price of a security or asset over a specified time frame, such as the 50-day, 100-day, or 200-day moving average.
The main purpose of using moving averages is to identify and confirm the direction of the current trend. By calculating the average price over a specific time period, moving averages can help filter out short-term price fluctuations and provide a clearer picture of the overall market trend.
There are two main types of moving averages: the simple moving average (SMA) and the exponential moving average (EMA). The SMA calculates the average price by summing up the closing prices over a specific number of periods and then dividing it by the number of periods. On the other hand, the EMA gives more weight to recent prices, making it more responsive to changes in price.
Moving averages can be used in various ways. Traders often look for crossovers between different moving averages to generate buy or sell signals. For example, a bullish signal may occur when a shorter-term moving average crosses above a longer-term moving average, indicating a potential upward trend. Conversely, a bearish signal may occur when a shorter-term moving average crosses below a longer-term moving average, suggesting a potential downward trend.
Additionally, moving averages can act as support or resistance levels. If the price of a security or asset is above its moving average, the moving average may serve as a support level, meaning that it may act as a barrier against further price declines. Conversely, if the price is below the moving average, the moving average may serve as a resistance level, acting as a barrier against further price increases.
In conclusion, moving averages are a fundamental tool in technical analysis that help traders and investors interpret market trends and make informed trading decisions. By smoothing out price data and identifying trend directions, moving averages provide valuable insights into the overall health of the market.
Read Also: Is Societe Generale a Prestigious Institution? Discover the Status of Societe Generale
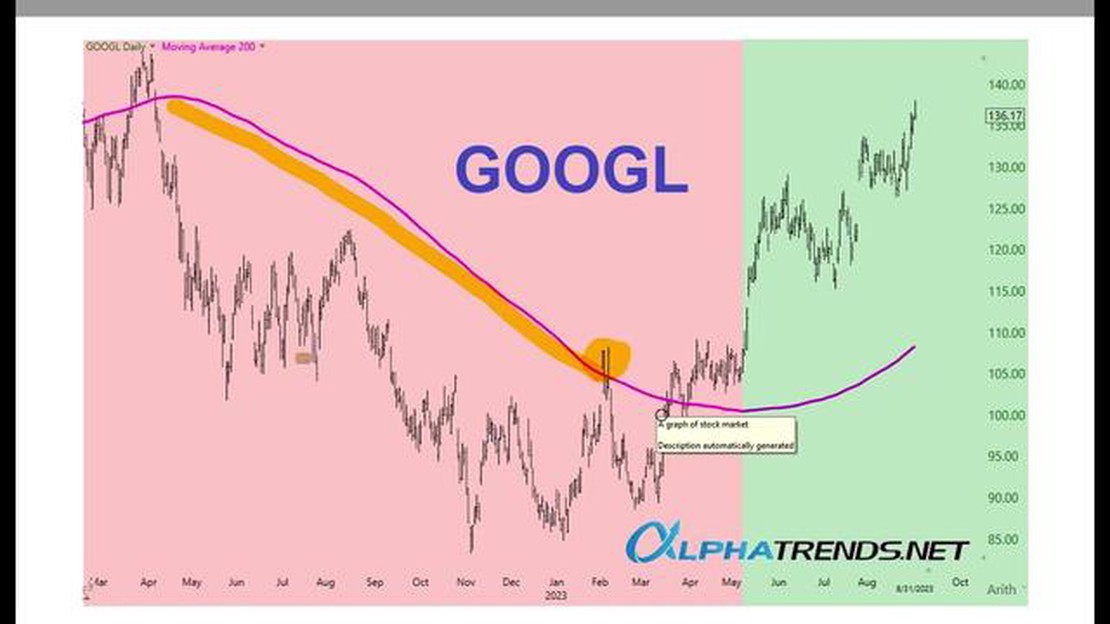
The 200-day moving average is a technical analysis tool used by traders and investors to identify the overall trend of a security or market. It is calculated by taking the average closing price of a security over the past 200 trading days.

The 200-day moving average is used in trading to help identify potential buy or sell signals. When a security’s price crosses above its 200-day moving average, it is often seen as a bullish signal and may indicate that the security is entering an uptrend. Conversely, when the price crosses below the 200-day moving average, it can be a bearish signal indicating a potential downtrend.
The 200-day moving average is considered significant because it reflects the long-term trend of a security or market. Many traders and investors use it as a guide to make trading decisions and determine the overall health of an investment. It is believed that the 200-day moving average can help filter out short-term noise and provide a clearer picture of the underlying trend.
Yes, the 200-day moving average can be used in different markets such as stocks, commodities, and foreign exchange. The concept behind the 200-day moving average remains the same regardless of the market. It is a widely followed technical indicator that can help traders and investors in various financial markets.
No, the 200-day moving average is just one of many moving averages used in trading. Other popular moving averages include the 50-day moving average and the 100-day moving average. Each moving average has its own significance and can provide different insights into the price action of a security or market.
The 200-day moving average is a technical analysis tool used by traders and investors to analyze the price trends of a stock or market index. It is calculated by taking the average closing price of an asset over the past 200 trading days and plotting it on a graph.
The 200-day moving average is used in trading to identify the long-term trend of a stock or market index. Traders commonly use it as a support or resistance level, with prices above the 200-day moving average considered bullish and prices below it considered bearish. It can also be used as a signal for buying or selling when the price crosses above or below the moving average.

Choosing the Best Moving Average for the 1H Chart When it comes to trading, using moving averages is a popular strategy among traders and investors. …
Read Article
Is IEP a Good Stock? When it comes to investing in stocks, one of the key factors to consider is the potential for growth and profitability. IEP …
Read Article
Guide: Removing Bollinger Band from MT4 If you are a trader using MetaTrader 4 (MT4) for your analysis and trading, you might have come across the …
Read Article
What is a Binary App? In the world of technology, binary code plays a crucial role in enabling computers and other electronic devices to communicate …
Read Article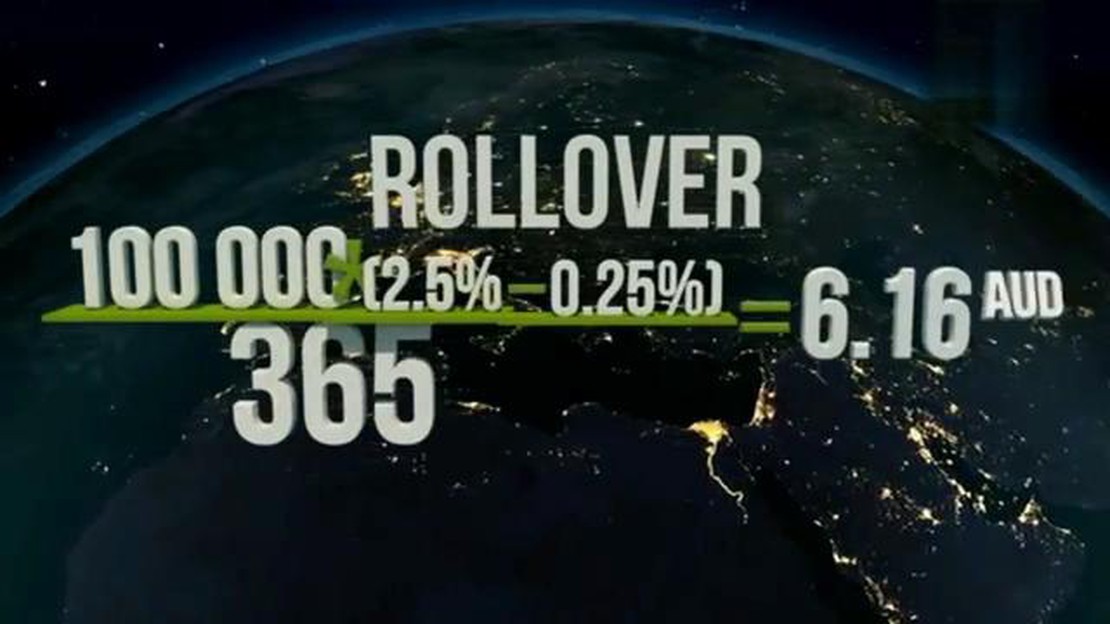
Understanding the Rollover Rate in Forex Trading When it comes to forex trading, there are a lot of terms and concepts that can be overwhelming for …
Read Article
Understanding the Regulation of FX Trading In the world of foreign exchange (FX) trading, understanding the regulations that govern this market is …
Read Article


