


Effective Strategies for Trading on a 1 Minute Chart - Expert Advice and Tips
Trading Strategies for the 1 Minute Chart: Tips and Tricks Trading on a 1 minute chart can be highly profitable, but it requires a specific set of …
Read Article

Outliers are data points that deviate significantly from the average or expected patterns within a dataset. These anomalies can arise due to errors in data collection, measurement inaccuracies, or the presence of rare events. Detecting and handling outliers is crucial in data analysis and can impact the interpretation and validity of statistical conclusions.
There are several techniques available to identify and handle outliers, each with its strengths and limitations. This article explores four commonly used methods: the z-score method, the interquartile range (IQR) method, the boxplot method, and the Mahalanobis distance method.
The z-score method involves calculating the standard score (z-score) for each data point, which measures how many standard deviations it is away from the mean. Data points with a z-score above a certain threshold are considered outliers. This method is simple and widely used, but it assumes a normal distribution and may not perform well with skewed data.
The IQR method uses the interquartile range, which is the difference between the third quartile (Q3) and the first quartile (Q1). Data points below Q1 - 1.5 * IQR or above Q3 + 1.5 * IQR are classified as outliers. This method is robust to outliers and suitable for skewed data, but it may not be effective for detecting outliers in multimodal distributions or small sample sizes.
The boxplot method is a graphical approach that provides a visual representation of the distribution of the data. Outliers are identified as points outside the whiskers of the boxplot, which are typically defined as 1.5 times the height of the box. Boxplots are useful for comparing multiple datasets but may not be as sensitive in detecting outliers compared to other methods.
The Mahalanobis distance method measures the distance of each data point from the centroid of the dataset, taking into account the correlation structure between variables. Points with a Mahalanobis distance above a certain threshold are considered outliers. This method is robust to correlations and has good performance with multivariate data, but it requires a large sample size and assumes a normal distribution.
Understanding and applying these outlier detection techniques can help researchers and analysts in various fields to identify and handle anomalies effectively, leading to more accurate and reliable data analysis results.
In data analysis, outliers refer to data points that deviate significantly from the normal range or trend of a dataset. Identifying and managing these anomalies is crucial for obtaining accurate insights and making informed decisions. Fortunately, several techniques have been developed to detect and handle outliers effectively. In this article, we will explore four commonly used techniques for outlier detection.
The Z-score method calculates the standard deviation to measure how many standard deviations a data point is away from the mean. Generally, a Z-score greater than a certain threshold (often 2 or 3) can be considered as an outlier. This method is useful when the dataset follows a normal distribution.

Tukey’s fences method utilizes the interquartile range (IQR) to identify outliers. The IQR is the range between the first quartile (Q1) and the third quartile (Q3) of the dataset. Any data point that falls below Q1 - (1.5 * IQR) or above Q3 + (1.5 * IQR) is considered an outlier. This method is robust against skewed or non-normal datasets.
The Mahalanobis distance calculates the distance between a data point and the centroid of the dataset, taking into account the covariance of the variables. An observation with a high Mahalanobis distance can be considered an outlier. This method is useful for datasets with multiple variables or dimensions.
The Isolation Forest algorithm is a machine learning-based technique for outlier detection. It constructs isolation trees by recursively partitioning the dataset, isolating the outliers in shorter paths compared to normal data points. The anomalies are then identified based on the number of partitions required to isolate them. This method is efficient and scalable for handling large datasets.
Once outliers are detected, they can be managed using various approaches. Some common strategies include:
Read Also: How to Add Options in OpenCart: A Step-by-Step Guide
Read Also: Is Reuters an Exchange? Understanding the Role of Reuters in the Financial Market
Overall, the accurate detection and appropriate management of outliers are essential for maintaining data integrity and improving the quality of analyses and decisions. By employing the techniques and strategies discussed in this article, analysts and researchers can effectively handle outliers and extract meaningful information from their datasets.
Statistical methods provide a powerful toolkit for identifying and handling outliers. By leveraging the inherent patterns and distributions in data, these methods can help researchers and analysts detect and address anomalies that may significantly impact the validity and reliability of their results.
One commonly used statistical method for outlier detection is the z-score. This method calculates the number of standard deviations that a data point deviates from the mean of a distribution. By setting a threshold, researchers can identify data points that fall outside a defined range and are considered statistically significant outliers.

Another statistical method is the modified z-score, which addresses limitations of the traditional z-score method. The modified z-score takes into account the median and the median absolute deviation (MAD) instead of the mean and standard deviation. This robust statistical approach is less sensitive to extreme values and can provide more accurate outlier detection in datasets with non-normal or skewed distributions.
Statistical methods also include the use of percentile-based techniques. These methods involve setting a threshold based on a percentile value, such as the 1st or 99th percentile. Data points falling below or above the defined threshold are considered outliers. Percentile-based techniques are particularly useful when dealing with data that follows a skewed distribution or has significant outliers in the tails of the distribution.
Furthermore, statistical methods like the Tukey’s fences and the Grubbs’ test offer robust procedures to detect outliers. Tukey’s fences use quartiles to define the inner and outer fences, which can identify outliers based on interquartile ranges. On the other hand, the Grubbs’ test is a hypothesis test that determines whether a data point significantly deviates from the mean. This method is useful for detecting outliers in normally distributed datasets.
In conclusion, statistical methods provide valuable tools for detecting outliers by leveraging the power of numbers. By understanding the underlying patterns and distributions in data, researchers and analysts can employ these methods to identify and address outliers that may affect the accuracy and reliability of their analyses.
Outliers are data points that differ significantly from other data points in a dataset. They are important to detect because they can have a significant impact on statistical analyses and machine learning models. Outliers can distort the results and lead to inaccurate conclusions. Therefore, it is important to identify and handle outliers properly in order to obtain reliable and meaningful results.
There can be several common causes of outliers in data. Some of them include measurement errors, data entry errors, data processing errors, or natural variations in the data. Outliers can also be caused by rare or extreme events that deviate from the normal behavior of the system being studied. It is important to consider these potential causes when analyzing and interpreting outliers in a dataset.
The four techniques for outlier detection are: 1) Statistical-based methods, such as z-score and modified z-score, which identify outliers based on the statistical properties of the data; 2) Distance-based methods, such as k-nearest neighbors and local outlier factor, which measure the distance or density of data points to identify outliers; 3) Model-based methods, such as linear regression and clustering, which use statistical models to identify data points that deviate from the expected pattern; 4) Ensemble methods, which combine multiple outlier detection techniques to improve accuracy and robustness.
Sure! Outlier detection can be applied in various real-life scenarios. For example, in finance, outlier detection can help identify fraudulent transactions or unusual patterns in financial data. In healthcare, outlier detection can be used to identify patients with abnormal medical readings or symptoms. In manufacturing, outlier detection can help identify faulty products or deviations from normal production processes. These are just a few examples of how outlier detection can be used to improve decision-making and problem-solving in different industries.

Trading Strategies for the 1 Minute Chart: Tips and Tricks Trading on a 1 minute chart can be highly profitable, but it requires a specific set of …
Read Article
Current Exchange Rate: 1 UN Peso equals Indian Rupees Are you planning a trip to India? Or do you have business dealings in the country? Understanding …
Read Article
Exchange Rate for THB to USD Are you planning a trip to Thailand and need to convert your US dollars to Thai Baht (THB)? Stay up-to-date with the …
Read Article
Robert Kiyosaki’s Views on Forex Trading Robert Kiyosaki, the renowned American entrepreneur and author, has been a vocal advocate for financial …
Read Article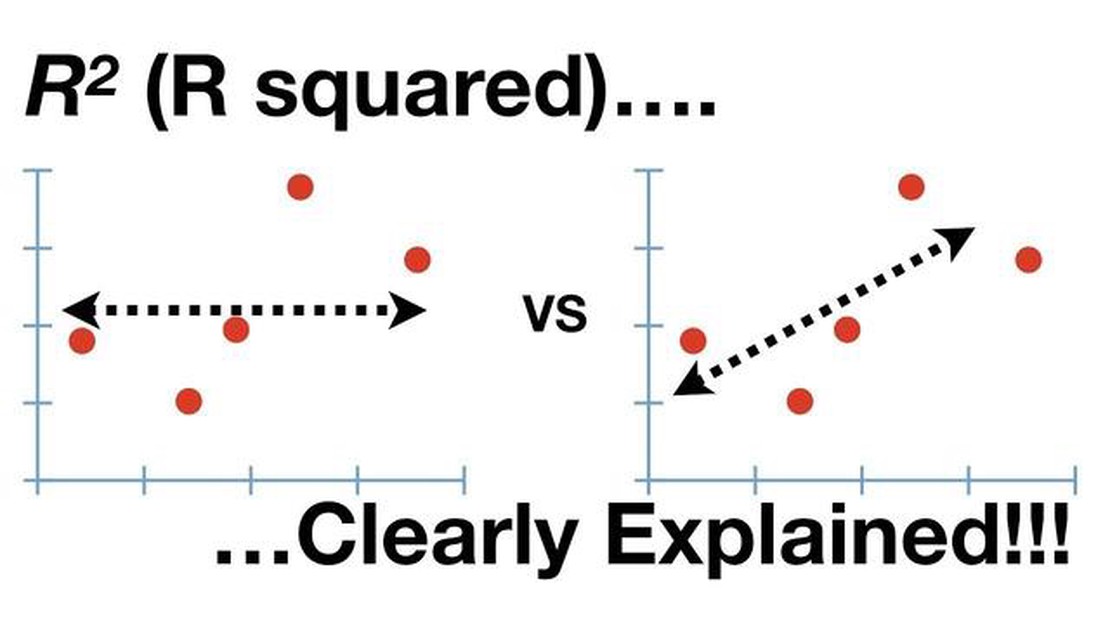
Understanding the Significance of an R-squared Value of 0.5 When analyzing data, one common statistical measure used is the R-squared value. The …
Read Article
Understanding the Mechanics of an Arma Model Arma is a widely popular video game that has garnered a dedicated fan base over the years. One of the …
Read Article

