How to Calculate the Quarterly Moving Average Trend
In the world of data analysis, trends are a powerful tool for understanding patterns and making predictions. One popular method for identifying trends is calculating the moving average, which smooths out fluctuations in data to reveal underlying patterns. In this step-by-step guide, we will walk you through the process of calculating the quarterly moving average trend.
Table Of Contents
Step 1: Gather the Data
The first step in calculating the quarterly moving average trend is to gather the data. This could be any set of data that you want to analyze, such as sales figures, stock prices, or website traffic. Make sure that the data is organized in quarterly intervals, with each point representing the value for a specific quarter.
Step 2: Determine the Number of Periods
Next, determine the number of periods over which you want to calculate the moving average trend. This could be any number, but a common choice is four quarters to represent a year. The number of periods will affect the level of smoothing in the trend line, with a larger number resulting in a smoother trend.
Step 3: Calculate the Moving Average
Now, it’s time to calculate the moving average. Take the sum of the values for the desired number of periods and divide it by the number of periods. Repeat this process for each quarter, shifting the window of periods one quarter at a time. This will give you a series of moving average values.
Step 4: Plot the Trend Line
Finally, plot the moving average values on a graph to visualize the trend line. Connect the points with a smooth line to show the overall trend. The trend line will reveal whether the data is increasing, decreasing, or staying relatively constant over time.
Conclusion
Calculating the quarterly moving average trend is a valuable skill for anyone involved in data analysis. By smoothing out fluctuations, the moving average helps to identify underlying patterns and make informed predictions. Follow these four steps to calculate the quarterly moving average trend and unlock the insights hidden in your data.
Calculating the Quarterly Moving Average Trend
The quarterly moving average trend is a statistical calculation used to analyze data and identify patterns over time. It is especially useful for analyzing fluctuating trends and smoothing out any random variations that may be present in the data.
To calculate the quarterly moving average trend, follow these steps:
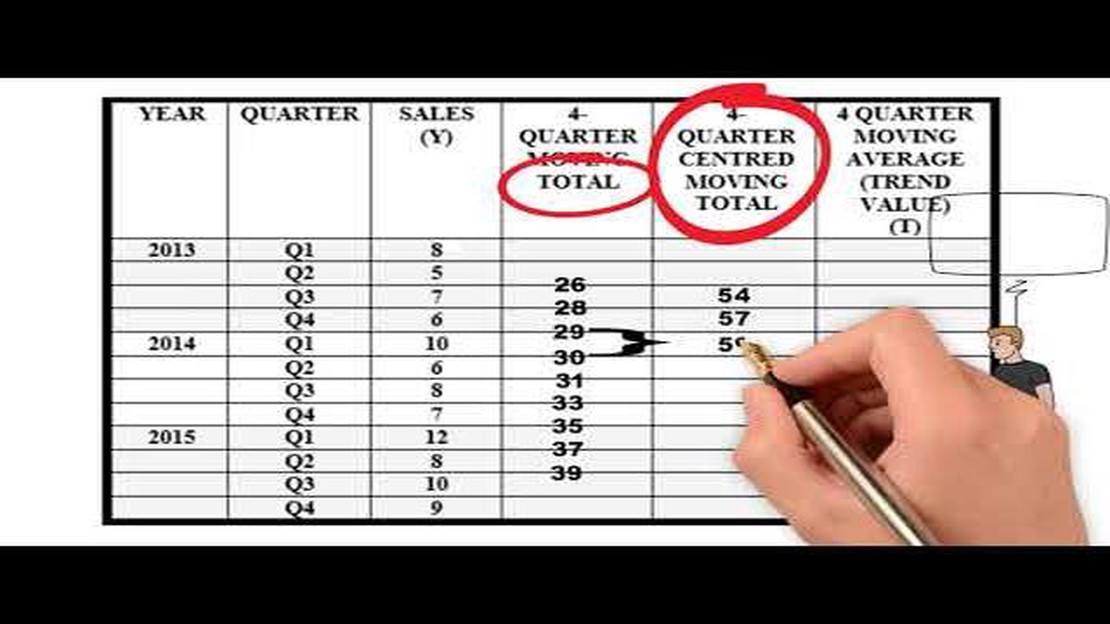
Step 1: Gather the quarterly data points you want to analyze. These could be sales figures, stock prices, or any other type of numerical data.
Step 2: Determine the period over which you want to calculate the moving average trend. For example, you may choose a four-quarter period to calculate the quarterly moving average trend.
Step 3: Calculate the moving average for each quarter. To do this, add up the data points for the specified period and divide by the number of data points included in the calculation. Repeat this process for each quarter.
Step 4: Plot the calculated moving averages on a graph to visualize the trend over time. This can help you identify any upward or downward trends that may be present in the data.
Step 5: Analyze the plotted data to interpret the quarterly moving average trend. Look for patterns such as consistent increases or decreases in the moving averages, and compare them to any external factors that may be influencing the data.
Step 6: Use the information gained from the analysis to make informed decisions and predictions about future trends based on the quarterly moving average trend.
By calculating the quarterly moving average trend, you can gain valuable insights into the underlying patterns and trends in your data. This can help you make more informed business decisions and improve your forecasting accuracy.
Remember that the quarterly moving average trend is just one tool in your analytical toolbox. It should be used in conjunction with other statistical methods and data analysis techniques to get a comprehensive understanding of your data.
Understanding the Quarterly Moving Average
The quarterly moving average is a statistical technique used to analyze time series data and identify trends over a specific time period. It is calculated by taking the average of a set of data points over a quarter, typically three months, and moving this average along the time series to observe changes in the trend.
By using the quarterly moving average, businesses and analysts can determine the underlying direction of the data and filter out short-term fluctuations, allowing them to make more informed decisions and forecasts. It smooths out the noise in the data, reducing the impact of outliers and seasonality.
The quarterly moving average is particularly useful when analyzing data with seasonal patterns, such as sales data. It can help identify the underlying trend and reveal patterns that may not be apparent when looking at the raw data alone.
The calculation of the quarterly moving average involves summing the data points over the quarter and dividing by the number of data points in the quarter. As new data becomes available, the oldest data point is dropped from the sum and replaced with the new data point. This ensures that the moving average reflects the most recent trend.
It is important to note that the choice of the length of the moving average can impact the results. A shorter moving average will be more responsive to short-term changes, while a longer moving average will be more stable and less sensitive to fluctuations.
The quarterly moving average can be visualized on a line graph, with the moving average plotted as a line overlaying the raw data points. This allows for a visual representation of the trend and makes it easier to identify changes in the direction of the data.
In conclusion, the quarterly moving average is a powerful tool for analyzing time series data and identifying trends. By smoothing out noise and revealing underlying patterns, it enables businesses and analysts to make more accurate predictions and informed decisions.
Step-by-Step Guide to Calculating the Quarterly Moving Average
The quarterly moving average is a commonly used statistical method to smoothen out fluctuations in a time series data set. It helps to identify trends and patterns over a specific period, making it a valuable tool for forecasting and decision-making. Here is a step-by-step guide on how to calculate the quarterly moving average:
Step 1: Collect the data for the time series. Ensure that the data is organized in a chronological order with equal time intervals, such as quarterly data.
Step 2: Calculate the average for the first quarter. Add up the values for all the data points in the first quarter and divide the sum by the number of data points in that quarter.
Step 3: Calculate the average for the second quarter. Add up the values for all the data points in the second quarter and divide the sum by the number of data points in that quarter.
Step 4: Repeat step 3 for each quarter in the time series, calculating the average for each quarter using the same formula.
Step 5: Record the calculated averages for each quarter. These will be the quarterly moving averages for the time series.
Step 6: Plot the quarterly moving averages on a graph to visualize the trends and patterns over time. This can help in understanding the direction of the data and identifying any significant changes.
Step 7: Analyze the quarterly moving averages to look for any upward or downward trends, or any patterns that might be useful for making forecasts or decisions.
Step 8: If desired, calculate the year-to-date moving averages by averaging the quarterly moving averages for each year. This can provide a broader perspective on the overall trend.
Step 9: Update the quarterly moving averages regularly as new data becomes available to keep track of the changing trends and patterns.
Calculating the quarterly moving average requires basic mathematical operations and can be easily done using spreadsheet software or statistical packages. By following this step-by-step guide, you can effectively calculate and analyze the quarterly moving average for your time series data.
FAQ:
What is a moving average trend?
A moving average trend is a way to smooth out fluctuations in data over a specified time period and identify the underlying trend.
Why is it important to calculate the moving average trend?
Calculating the moving average trend is important because it can help identify long-term trends, filter out short-term fluctuations, and make more accurate predictions.
How is the quarterly moving average trend calculated?
The quarterly moving average trend is calculated by taking the average of the data points for each quarter over a specified number of quarters.
Can the length of the moving average period be adjusted?
Yes, the length of the moving average period can be adjusted depending on the specific needs and characteristics of the data.
What are some potential pitfalls when calculating the moving average trend?
Some potential pitfalls when calculating the moving average trend include using too short of a moving average period, not considering seasonality, and not taking into account outlier data points.
What is a moving average trend?
A moving average trend is a calculated value used to analyze data over a certain period of time and smooth out fluctuations. It helps identify trends or patterns in the data.
How can I calculate a quarterly moving average trend?
To calculate a quarterly moving average trend, you need to first select a suitable time period, such as 3 months. Next, add up the values for each quarter and divide by the number of quarters to find the average. Repeat this process for each quarter, and plot the average values on a graph to observe the trend.
What is the difference between forex risk and forex exposure? Forex (foreign exchange) involves trading one currency for another in the global market. …