


Is Forex Free? The Truth About Trading Currency
Is Forex Free? Forex, or foreign exchange, is a decentralized market where individuals and institutions trade various currencies. Many people are …
Read Article
A time series is a collection of data points that are recorded in chronological order over a period of time. It is used to analyze past patterns and predict future trends. One of the most commonly used techniques in time series analysis is the moving average.
A moving average is a statistical tool that calculates the average of a subset of data points within a specified time period. It is called “moving” because the subset of data points used to calculate the average moves along the time series. This technique helps to identify trends and smooth out the noise or random fluctuations in the data.
The moving average is defined as the sum of the data points divided by the number of data points in the subset. It is often represented by the symbol MA. The moving average can be calculated for different time periods, depending on the frequency of the data and the desired level of analysis. For example, a 10-day moving average calculates the average of the past 10 days’ data points.
The moving average has various applications in time series analysis. It is commonly used to identify trends and seasonality in the data. By smoothing out the noise, the moving average allows analysts to see the underlying patterns more clearly. It is also used for forecasting future values based on the historical data. Additionally, the moving average is used in technical analysis of financial markets to generate trading signals and identify buy or sell points.
In conclusion, the moving average is a powerful tool in time series analysis that helps to identify trends, smooth out noise, and make predictions based on historical data. It has a wide range of applications in various industries, from finance to sales forecasting. Understanding the moving average is essential for anyone working with time series data.
A moving average (MA) is a statistical calculation used to analyze data points over a certain period of time. It is commonly used in time series analysis to smooth out fluctuations and trends in data, making it easier to identify patterns and make predictions.

The moving average is calculated by taking the average of a set of data points within a specified time frame. The size of the time frame, also known as the window or period, can be adjusted to suit the specific analysis or forecasting needs.
The moving average is often used as a tool to remove short-term fluctuations in data and highlight long-term trends. It is particularly useful in financial analysis, where it is commonly used to analyze stock prices, exchange rates, and other time series data.
There are different types of moving averages, including the simple moving average (SMA) and the exponential moving average (EMA). The SMA assigns equal weight to each data point within the time frame, while the EMA assigns more weight to recent data points, making it more responsive to changes in the data.
Overall, the moving average is a powerful tool in time series analysis that helps to enhance understanding and make better predictions by smoothin out data and identifying trends.
Read Also: What is a Good Long Short Ratio? Expert Insights and Tips
The moving average is a commonly used statistical method in time series analysis. It has various applications in finance, economics, weather forecasting, signal processing, and many other fields. Here are some of the key applications of the moving average:
1. Trend Analysis: The moving average is often used to identify and analyze trends in time series data. By calculating the moving average over a certain time period, it helps smoothen out the fluctuations and highlight the underlying trend. This is particularly useful in forecasting future values and making informed decisions.
2. Seasonal Adjustment: The moving average can be used to remove seasonal patterns in data. It helps create a deseasonalized series that facilitates better understanding of the underlying structure and long-term patterns. This is essential in areas such as economics and finance to analyze business cycles and make accurate forecasts.
3. Signal Filtering: The moving average is commonly used in signal processing to filter out noise and unwanted fluctuations. By averaging out the values over a specific time window, it helps identify and extract the underlying signal from noisy data. This is particularly useful in areas such as audio and image processing.
Read Also: How much does an L4 make at Google? Salary Insights
4. Forecasting: The moving average is widely used for forecasting future values. By analyzing the historical data and calculating the moving average over a certain time period, it helps identify trends and patterns that can be used to predict future values with reasonable accuracy. This is essential in areas such as financial markets, supply chain management, and demand forecasting.
5. Technical Analysis: The moving average is extensively used in technical analysis of financial markets. It helps identify key support and resistance levels, trend reversals, and trading signals. Traders and investors often use moving averages of different time periods to make buy/sell decisions and develop trading strategies.
Overall, the moving average is a versatile tool with widespread applications in various fields. It helps analyze and interpret time series data, identify trends and patterns, filter out noise, make accurate forecasts, and support decision-making.
A moving average is a statistical calculation used to analyze time series data by creating a series of averages of different subsets of the full data set.

The purpose of using a moving average in time series analysis is to smooth out the noise and volatility in the data, making it easier to identify the underlying trends and patterns.
A simple moving average is calculated by adding up a certain number of data points and then dividing the sum by the number of data points. This calculation is repeated for each subset of data in the time series.
The main difference between a simple moving average and an exponential moving average is the weight assigned to each data point. In a simple moving average, all data points are equally weighted, whereas in an exponential moving average, more weight is given to recent data points.
Moving averages have various applications, including forecasting future values, identifying short-term trends, and smoothing out data for easier analysis. They are commonly used in finance, economics, and stock market analysis.

Is Forex Free? Forex, or foreign exchange, is a decentralized market where individuals and institutions trade various currencies. Many people are …
Read Article
Understanding FX Allowance: A Comprehensive Guide In today’s globalized world, the foreign exchange (FX) market plays a crucial role in facilitating …
Read Article
Understanding the Position Trading Strategy in Forex Position trading is a long-term investment strategy that traders use in the forex market to take …
Read Article
Current Price of Aluminium Aluminium, an essential metal in many industries, plays a crucial role in the global economy. It is lightweight, durable, …
Read Article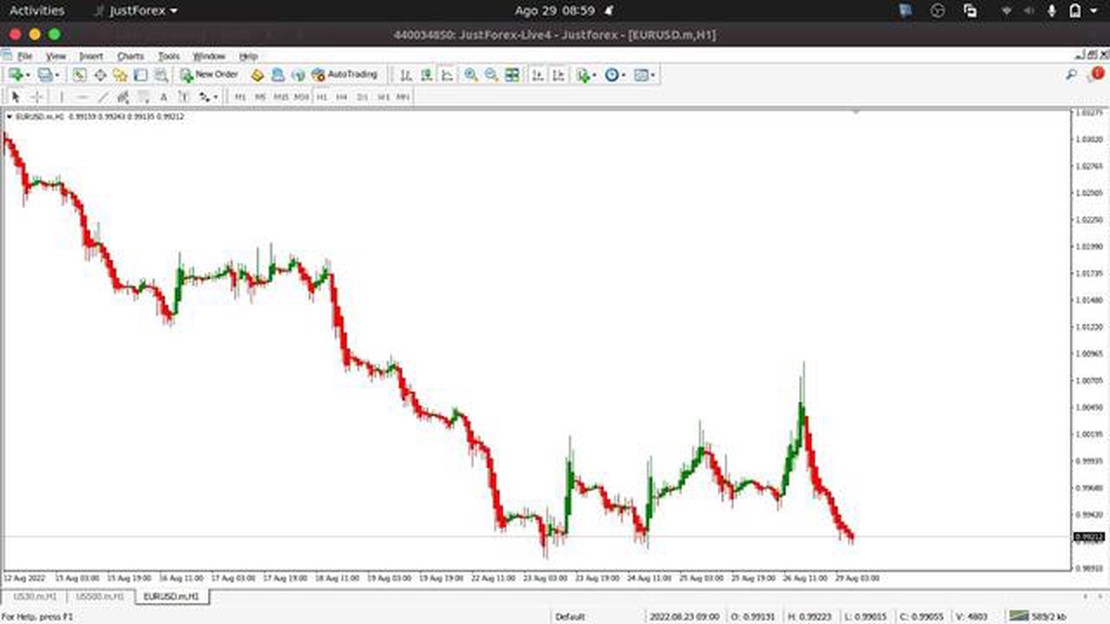
Metatrader 4 and Heikin Ashi Candles: A Comprehensive Guide If you’re a trader using Metatrader 4, you may be wondering whether this popular trading …
Read Article
Is Forex Trading an Investment? Forex, short for foreign exchange, is the largest financial market in the world. It involves the buying and selling of …
Read Article


