


Understanding the Capital Gains Tax on Forex Trading in Canada
Understanding Capital Gains Tax on Forex in Canada Forex trading has become increasingly popular in Canada, with many individuals trying their hand at …
Read Article
When it comes to analyzing financial data, the standard deviation is a widely used statistical measure. It helps us understand the variability or dispersion of a data set. In the realm of technical analysis, the Exponential Moving Average (EMA) is a popular indicator for trend analysis. Understanding the standard deviation of EMA can provide valuable insights into market trends and potential trading opportunities.
The EMA is a type of moving average that places more weight on recent data points, making it more responsive to changes in price. It is calculated using a specific formula that takes into account a user-defined period of time. The standard deviation of EMA, on the other hand, measures the volatility or the spread of the EMA values around the mean. It helps traders identify periods of high or low volatility, which can have implications for trading strategies.
To calculate the standard deviation of EMA, we first need to calculate the EMA itself. Once we have the EMA values, we can then calculate the standard deviation using a formula that involves taking the difference between each EMA value and the mean of the EMA values, squaring the result, and averaging the squared differences. This gives us a measure of the dispersion of the EMA values.
The standard deviation of EMA can be interpreted in different ways depending on the specific context. A high standard deviation suggests that the EMA values are spread out or volatile, indicating a higher degree of market uncertainty. This can be an opportunity for traders who thrive on volatility. Conversely, a low standard deviation suggests that the EMA values are tightly clustered around the mean, implying a more stable market environment. Traders who prefer less risk may find such periods more favorable for trading.
The Exponential Moving Average (EMA) is a commonly used technical analysis tool in the field of finance. It is highly regarded by traders and analysts for its ability to provide a smooth and responsive representation of price data. The EMA places more weight on recent data points, which makes it particularly useful in identifying trends and predicting future price movements.
One of the key advantages of the EMA is its ability to filter out noise and eliminate outliers. By giving more weight to recent data, the EMA provides a more accurate depiction of the current market conditions, without being overly influenced by outdated or irrelevant information. This is especially beneficial in volatile markets, where sudden price fluctuations can distort the overall trend.
Another important aspect of the EMA is its ability to provide timely signals for buying and selling decisions. The EMA reacts quickly to price changes, allowing traders to capture early signals of trend reversals or price breakouts. This can help traders enter or exit positions at more favorable prices, increasing their chances of making profitable trades.

Moreover, the EMA is often used in conjunction with other technical indicators to confirm trading signals and enhance their reliability. For example, combining the EMA with other trend-following indicators such as the Moving Average Convergence Divergence (MACD) or the Average Directional Index (ADX) can provide a more comprehensive and robust analysis of market trends.
In summary, the EMA is an invaluable tool for financial analysis due to its ability to provide a smooth and responsive representation of price data, filter out noise and eliminate outliers, generate timely signals for buying and selling decisions, and enhance the reliability of trading signals when used in combination with other technical indicators. Traders and analysts rely on the EMA to gain valuable insights into market trends and make informed investment decisions.
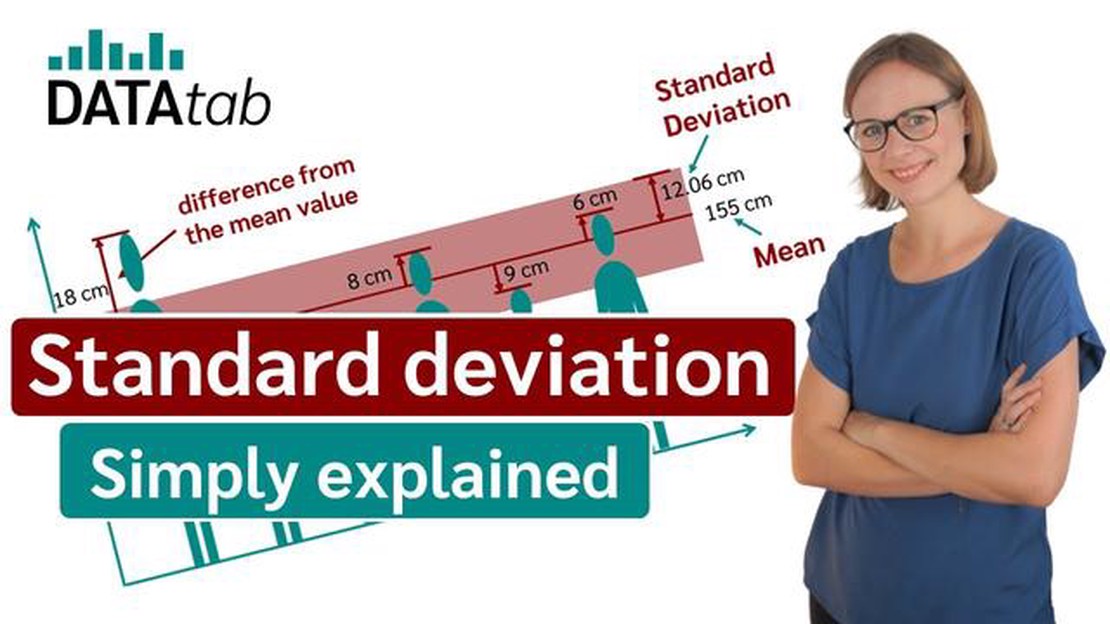
Standard Deviation is a statistical measure that reflects the amount of variation or dispersion in a set of values. It shows how much the values differ from the mean or average value.
A high standard deviation indicates that the values are widely spread out from the mean, while a low standard deviation indicates that the values are close to the mean.
Standard deviation is calculated by taking the square root of the variance. Variance measures the average squared deviation from the mean. By taking the square root of the variance, we obtain the standard deviation, which is expressed in the same units as the original data.
Read Also: What is the average duration of a trade in the forex market?
Standard deviation is commonly used across various fields, including finance, engineering, and biology, to analyze and understand the variability of data. It provides valuable insights into the predictability and consistency of a set of values.
When it comes to the Exponential Moving Average (EMA), understanding the standard deviation of the EMA helps traders and analysts determine the amount of volatility and risk associated with the underlying asset or market. It enables them to make informed decisions and assess potential outcomes.
Understanding the standard deviation of an exponential moving average (EMA) can be a daunting task for many individuals. However, by simplifying the complexity of this concept, it becomes easier to interpret and apply in practical situations.
The standard deviation of EMA is a measure of the volatility or variability in the values of the EMA. It provides insights into how widely spread out the values of the EMA are from its average value. A higher standard deviation indicates greater volatility, while a lower standard deviation suggests less volatility.
Read Also: What is Draco slang? Uncovering the meaning and origins of this popular term
| Standard Deviation | Interpretation |
|---|---|
| Low | The values of the EMA are relatively close to its average, indicating a more stable market. |
| High | The values of the EMA are widely spread out from its average, suggesting a more volatile market. |
By understanding the standard deviation of EMA, traders and investors can make better-informed decisions. For example, a low standard deviation may signal a period of consolidation or stability in the market, which may present opportunities for range-bound trading strategies. On the other hand, a high standard deviation may indicate a market with significant price swings, which could be suitable for trend-following or momentum-based strategies.
It is worth noting that the interpretation of standard deviation of EMA should be done in conjunction with other technical indicators and market analysis. Combining multiple indicators can provide a more comprehensive view of market conditions and enhance decision-making processes.
In conclusion, simplifying the complexity of the standard deviation of EMA allows individuals to gain a better understanding of its interpretation. By recognizing the relationship between standard deviation and market volatility, traders and investors can leverage this information to improve their trading strategies and decision-making abilities.
EMA stands for Exponential Moving Average. It is a type of moving average that places more weight on recent data points and gives less weight to older data points. This helps to emphasize recent trends and make the average more responsive to recent changes in the data.

The standard deviation of EMA is calculated by first calculating the EMA values for the given data set. Then, the standard deviation is calculated for the EMA values using the formula for calculating standard deviation.
The standard deviation is important in EMA because it provides a measure of volatility or dispersion of the EMA values. A higher standard deviation indicates greater volatility, while a lower standard deviation indicates lower volatility. This information can be useful in analyzing and interpreting the EMA values.
The standard deviation of EMA helps in technical analysis by providing information about the volatility and stability of the data. Traders and analysts can use the standard deviation to assess the risk and potential returns of an investment. It can also help in identifying overbought or oversold conditions in the market.
Sure! Let’s say we have a data set of daily closing prices for a stock over the past 30 days. We calculate the EMA values for this data set and then calculate the standard deviation of the EMA values. A higher standard deviation indicates that the stock’s price has been more volatile in the past 30 days, while a lower standard deviation indicates greater stability in the stock’s price.
The standard deviation of EMA is a measure of the volatility or variability of the exponential moving average. It calculates how spread out the EMA values are from the average value over a certain period of time.

Understanding Capital Gains Tax on Forex in Canada Forex trading has become increasingly popular in Canada, with many individuals trying their hand at …
Read Article
Can You Get a 7% Interest Savings Account? When it comes to saving money, finding the right savings account can make a big difference. But with so …
Read Article
Choosing the Best Indicator for 5-Minute Trading Are you tired of trying different trading strategies that just don’t seem to work? Have you been …
Read Article
Does Commonwealth Bank offer currency exchange services? Welcome to Commonwealth Bank, your trusted partner for all your foreign currency needs. …
Read Article
Exploring the Trading Up and Trading Down Strategy When it comes to making purchase decisions, consumers often find themselves torn between the desire …
Read Article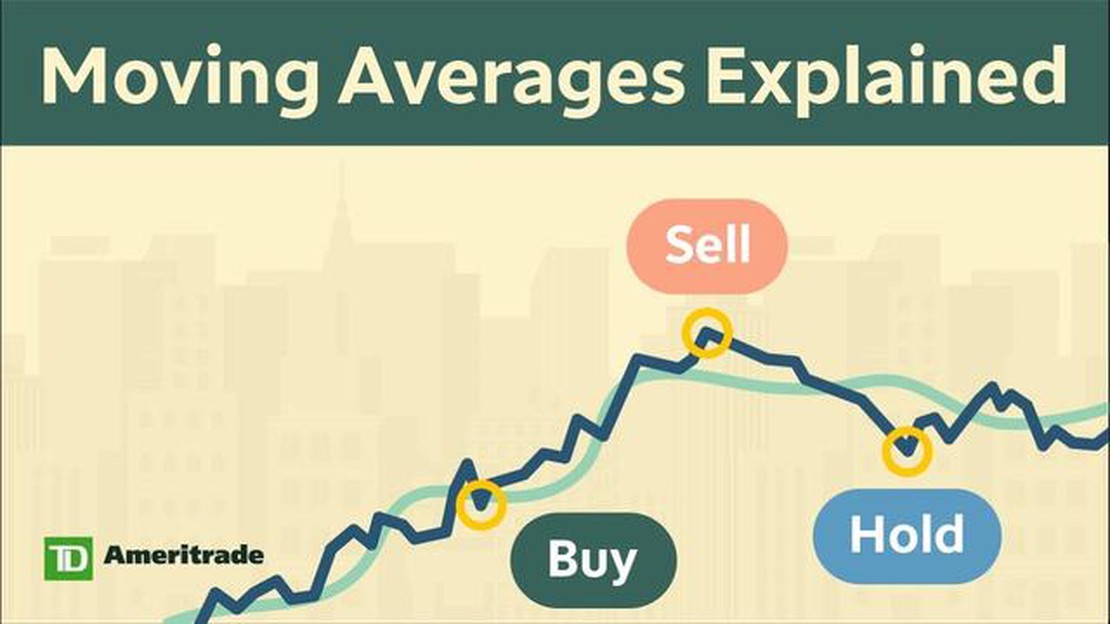
Understanding the Moving Average in Share Price Share price analysis is an essential tool for investors and traders, enabling them to make informed …
Read Article


