


Understanding the Basics of Calendar Option Trading
Understanding Calendar Option Trades Calendar option trading is a commonly used strategy among traders in the financial markets. This strategy …
Read Article
Share price analysis is an essential tool for investors and traders, enabling them to make informed decisions about buying or selling stocks. One of the key techniques used in share price analysis is the moving average. The moving average is a widely used indicator that helps identify trends and potential reversal points in a stock’s price.
A moving average is calculated by taking the average price of a stock over a certain period of time. This period could be as short as a few days or as long as several years, depending on the investor’s strategy and the timeframe in which they are analyzing the stock. By calculating the moving average, investors can smooth out the price data and identify the overall trend of the stock.
The moving average is often used to identify support and resistance levels in a stock’s price. Support levels are price levels at which the stock has historically had difficulty falling below, while resistance levels are price levels at which the stock has historically had difficulty rising above. By plotting the moving average on a chart, investors can easily identify these key levels and determine whether the stock is likely to continue its current trend or reverse direction.
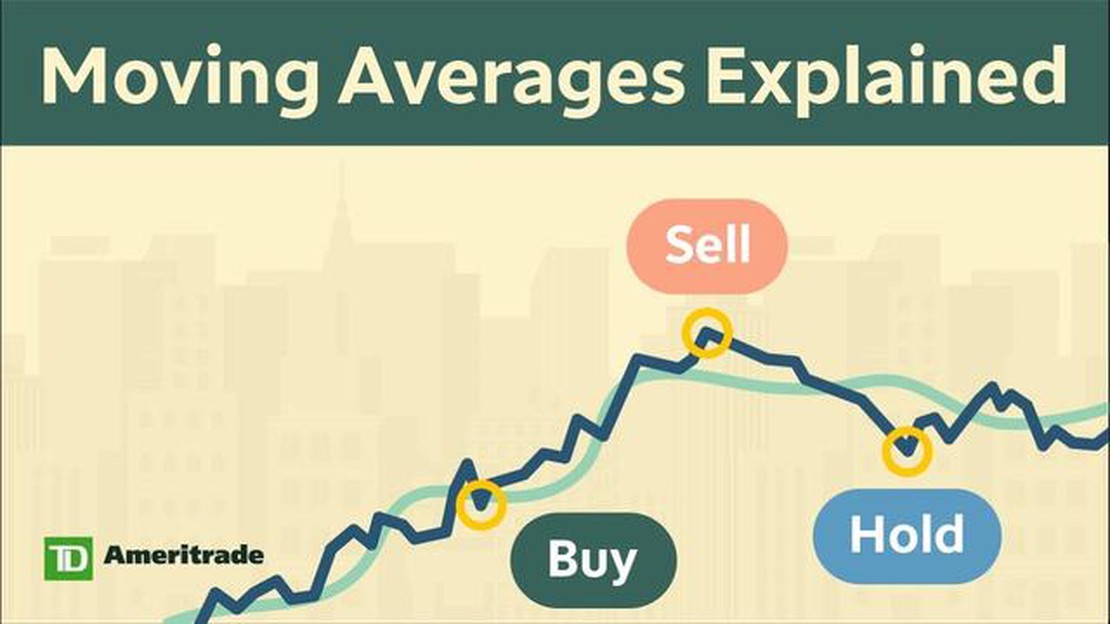
Furthermore, the moving average can also be used to generate trading signals. For example, when the stock price crosses above the moving average, it may be a signal to buy, indicating that the stock is in an uptrend. Conversely, when the stock price crosses below the moving average, it may be a signal to sell, indicating that the stock is in a downtrend. These signals can help investors enter or exit a position at the right time and maximize their potential profits.
Understanding the moving average is crucial for any investor or trader looking to make sound decisions in the stock market. By using this powerful tool, investors can gain a better understanding of a stock’s trend, identify key support and resistance levels, and generate actionable trading signals. Whether you are a novice investor or an experienced trader, incorporating the moving average into your share price analysis can greatly improve your chances of success in the stock market.
A moving average is a commonly used technical analysis indicator that is used to analyze the trend of a security’s price over a specific period of time. It is calculated by taking the average of a set number of data points, typically closing prices of the security, over a certain period of time.
The moving average is represented by a line that smooths out the price fluctuations of a security and helps to identify the direction of the trend. It is used to filter out the noise in the price data and to provide a clearer picture of the overall trend.
The calculation of a moving average involves adding together the prices of the security over a specific period of time and then dividing that sum by the number of data points in the period. For example, a 10-day moving average would be calculated by adding together the closing prices of the security for the past 10 days and then dividing that sum by 10.
The moving average is typically displayed on a price chart as a line that connects the average prices over the specified period of time. Traders and investors use moving averages to help them make decisions about buying and selling securities.
Moving averages are widely used in share price analysis to identify trends and patterns in the data. By smoothing out short-term price fluctuations, moving averages help traders and investors make more informed decisions about buying and selling shares.
Read Also: Reasons Why Forex Trading is Banned in the USA
One common application of moving averages is to determine support and resistance levels. The moving average line acts as a support level when the share price is above it, indicating that the price may be on an upward trend. Conversely, the moving average line acts as a resistance level when the share price is below it, suggesting that the price may be on a downward trend.
Another application of moving averages is to generate trading signals. When the share price crosses above the moving average line, it may be a signal to buy shares, as it suggests that the price may continue to rise. On the other hand, when the share price crosses below the moving average line, it may be a signal to sell shares, as it suggests that the price may continue to fall.
Read Also: How Does a Music Box Work? | Everything You Need to Know
It is important to note that moving averages are not foolproof indicators and should not be used in isolation. They are best used in conjunction with other technical analysis tools and indicators to confirm signals and make more accurate predictions.
| Advantages | Disadvantages |
|---|---|
| Easy to understand and calculate | May lag behind real-time price movements |
| Smooth out short-term price fluctuations | May generate false signals in volatile markets |
| Help identify trends and patterns | Do not take into account fundamental factors |
In conclusion, moving averages are valuable tools in share price analysis. They can help traders and investors identify trends, determine support and resistance levels, and generate trading signals. However, they should be used in conjunction with other analysis techniques and should not be relied upon as the sole basis for making investment decisions.
A moving average is a calculation used to analyze the trend of a stock’s price over a specific period of time. It helps smooth out volatility and identify potential support and resistance levels.
Moving average can be calculated by adding up the closing prices of a stock over a specific period of time and dividing it by the number of periods.

There are three common types of moving averages: simple moving average (SMA), exponential moving average (EMA), and weighted moving average (WMA).
Moving averages are used to identify trends and potential reversal points in stock prices. They can also be used to generate buy or sell signals based on the crossovers between different moving averages.
Moving averages can be used in combination with other technical indicators such as MACD or RSI to confirm signals and increase the accuracy of stock price analysis.
A moving average is a mathematical calculation that is used to analyze the trends in the share price of a stock. It is calculated by taking the average of a set number of previous data points over a specified period of time.

Understanding Calendar Option Trades Calendar option trading is a commonly used strategy among traders in the financial markets. This strategy …
Read Article
Key Elements of Trade Setup in Forex Forex trading is a complex and dynamic market where currencies are bought and sold. To be successful in this …
Read Article
How often do you move houses? Relocating to a new home is a major life decision that many people face at some point in their lives. Whether it’s for …
Read Article
How to create tabs dynamically in jQuery? Welcome to our step-by-step tutorial on creating dynamic tabs with jQuery! Tabs are a popular way to …
Read Article
What is the Biggest Loss of the Swiss National Bank? The Swiss National Bank (SNB) is known for its conservative approach to financial management and …
Read Article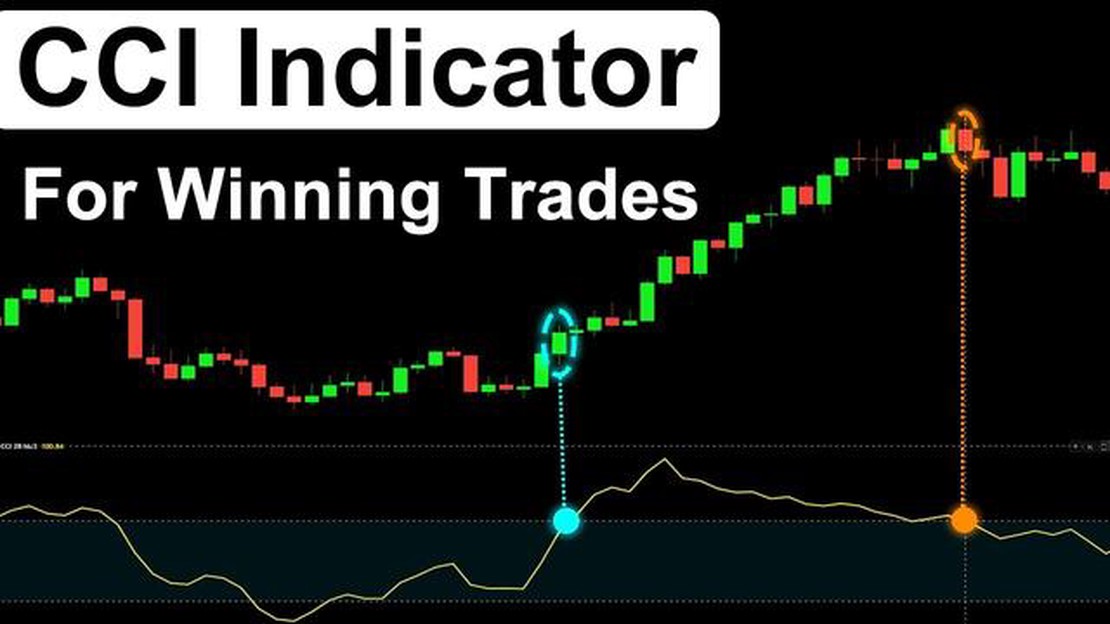
Understanding CCI in Trading View The Commodity Channel Index (CCI) is a popular technical analysis tool used by traders to identify overbought or …
Read Article


