

Is GDX a good fund? Expert analysis and performance review
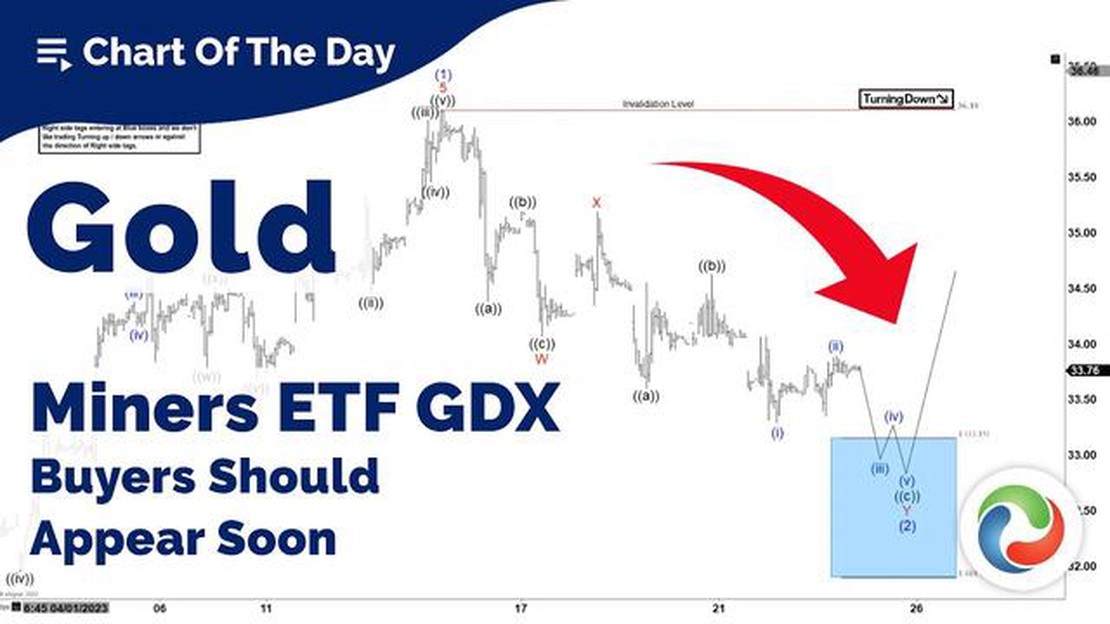
Is GDX a good fund? When it comes to investing in gold mining companies, one popular option for many investors is the VanEck Vectors Gold Miners ETF …
Read Article
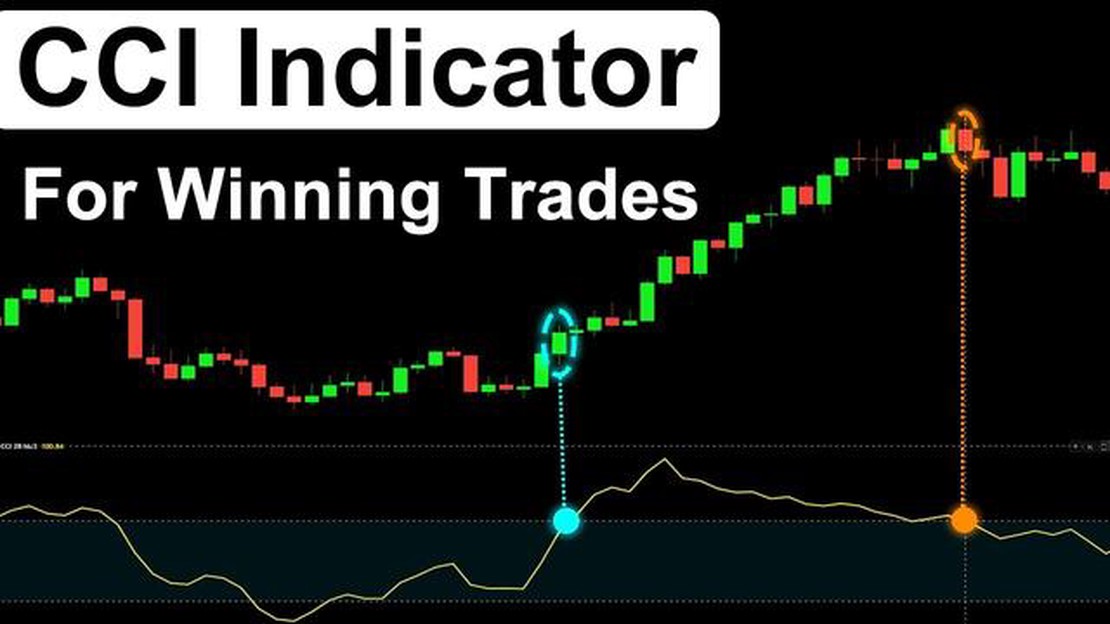
The Commodity Channel Index (CCI) is a popular technical analysis tool used by traders to identify overbought or oversold conditions in the market and potential reversal points. Developed by Donald Lambert in 1980, CCI is a versatile indicator that can be applied to various markets, including stocks, commodities, and forex.
CCI measures the difference between the current price and its average price over a specified period of time. It is calculated using the formula: CCI = (Typical Price - SMA) / (0.015 x Mean Deviation), where SMA is the simple moving average and Mean Deviation is the mean deviation from the average price.
The CCI indicator is displayed as a line graph that oscillates around a zero level. Values above zero indicate that the price is above the average, suggesting bullish sentiment, while values below zero indicate that the price is below the average, suggesting bearish sentiment. Traders typically look for extreme levels above +100 or below -100 to identify potential buying or selling opportunities.
While CCI is primarily used to identify overbought or oversold conditions, it can also be used to generate trade signals. Traders often look for divergences between price and CCI, where the price makes a higher high or lower low, but CCI fails to confirm the move. This can be an indication of a potential trend reversal.
Overall, understanding the Commodity Channel Index (CCI) is important for traders who want to incorporate technical analysis into their trading strategy. By identifying overbought or oversold conditions and potential reversal points, CCI can help traders make more informed decisions and improve their trading performance.
The Commodity Channel Index (CCI) is a technical indicator that is used in the field of technical analysis to help traders identify potential overbought and oversold levels in the market. It was developed by Donald Lambert and was first introduced in the Commodities Magazine in 1980. The CCI is designed to measure the current price level relative to an average price level over a specified period of time, typically 20 or 14 periods.
The CCI is calculated using the following formula:

CCI = (Typical Price - N-period Simple Moving Average of Typical Price) / (0.015 x Mean Deviation)
The Typical Price is calculated by taking the average of the high, low, and closing prices for a given period. The Simple Moving Average (SMA) is then calculated using the Typical Price, and the Mean Deviation is the average of the absolute differences between the Typical Price and the SMA over the same period.
The CCI oscillates around a zero line, with positive values indicating that the price is above the average price level and negative values indicating that the price is below the average price level. Traders often use the CCI to identify potential trend reversals or to confirm the strength of an existing trend. When the CCI is above the zero line, it is considered to be in bullish territory, indicating potential buying opportunities. Conversely, when the CCI is below the zero line, it is considered to be in bearish territory, indicating potential selling opportunities.
It is important to note that while the CCI can provide valuable insights into market conditions, it is not a standalone indicator and should be used in conjunction with other technical analysis tools and indicators to make informed trading decisions.
The Commodity Channel Index (CCI) is a popular technical analysis indicator used in trading. It was developed by Donald Lambert in the late 1970s and is used to identify potential price reversals, overbought and oversold conditions, and trend strength.
The CCI is calculated by taking the average of the typical price (the average of the high, low, and close prices for a given period) and subtracting it from the simple moving average of the typical price over the same period. The result is then divided by a mean deviation to normalize the value.
Read Also: Is Forex a Spot or Future? Explained in Depth
The result of this calculation is a value that fluctuates above and below a zero line. Positive values above the zero line indicate that the price is trending higher, while negative values below the zero line indicate a downward trend. The further away the value is from the zero line, the stronger the trend.
The CCI is also used to identify overbought and oversold conditions. When the indicator is above +100, it suggests that the price is overbought and a downward reversal may occur. Conversely, when the indicator is below -100, it suggests that the price is oversold and an upward reversal may occur.
Read Also: Understanding the Convolution Average Filter: Definition and Application
Traders use the CCI in conjunction with other technical analysis tools to make trading decisions. For example, they may use the CCI to confirm a trend identified by another indicator, or to identify potential entry and exit points.
It’s important to note that like any technical analysis indicator, the CCI is not foolproof and should be used in conjunction with other indicators and analysis techniques. It is also important to consider other factors such as market conditions, news events, and fundamental analysis when making trading decisions.
The Commodity Channel Index (CCI) is a popular technical indicator used by traders to identify overbought and oversold conditions in the market. It was developed by Donald Lambert and first introduced in 1980. The CCI measures the current price level relative to an average price level over a specified period of time. It is typically used to detect potential price reversals and assess the strength of a market trend.
The CCI is calculated by taking the difference between the current price and its simple moving average (SMA), and then dividing it by a constant multiple of the mean absolute deviation (MAD). The result is a normalized value that fluctuates between -100 and +100.
When the CCI is above +100, it is considered overbought, indicating that the market may be due for a downward correction. Conversely, when the CCI is below -100, it is considered oversold, indicating that the market may be due for an upward correction. Traders often look for these extreme levels to enter trades in the opposite direction of the recent trend.
In addition to detecting overbought and oversold conditions, the CCI can also be used to identify trend strength. When the CCI is consistently above +100 or below -100, it suggests that the market is in a strong trend. Traders may use this information to stay in their positions and avoid premature exits.

It’s important to note that like any technical indicator, the CCI is not foolproof and should not be used in isolation. It is best used in conjunction with other indicators and analysis techniques to confirm signals and make informed trading decisions.
The Commodity Channel Index (CCI) is a technical indicator used in trading to measure the current price level in relation to an average price over a given period of time. It helps identify overbought and oversold levels and can be used to generate buy and sell signals.
The CCI is calculated using the following formula: CCI = (Typical Price - Simple Moving Average) / (0.015 * Mean Deviation), where the Typical Price is the average of the high, low, and closing prices for a given period, the Simple Moving Average is the average of the Typical Prices over the same period, and the Mean Deviation is the average of the absolute differences between the Typical Prices and the Simple Moving Average over the same period.
When the CCI is positive, it indicates that the current price is above the average price and there may be a bullish trend or buying pressure in the market. Traders may interpret this as a potential opportunity to enter a long position.
Yes, the CCI can be used for different timeframes, such as daily, weekly, or monthly charts. Traders can adjust the period setting of the CCI to suit their trading style and the timeframe they are analyzing. Smaller periods, such as 14 or 20, are commonly used for shorter-term trading, while larger periods, such as 50 or 100, are used for longer-term analysis.

Is GDX a good fund? When it comes to investing in gold mining companies, one popular option for many investors is the VanEck Vectors Gold Miners ETF …
Read Article
Understanding HNS in Forex Trading: A Comprehensive Guide When it comes to Forex trading, there are numerous technical analysis methods that traders …
Read Article
Comparing 40 pence and 0.70 with online currency conversion When it comes to comparing currencies, it’s important to consider not only the numerical …
Read Article
When will XAUUSD reopen? Gold has always been a popular investment option for both seasoned traders and beginners. XAUUSD is a widely traded currency …
Read Article
Understanding the GMT Offset for Forex Brokers When it comes to forex trading, understanding the GMT offset is crucial. The GMT offset, also known as …
Read Article
Reasons Behind the Depreciation of the AUD The Australian dollar (AUD) has experienced a significant drop in value over recent months, leading many to …
Read Article


