


Best Places to Exchange Money in Turkey | Currency Exchange Guide
Where to Exchange Money in Turkey If you are planning a trip to Turkey, it is important to be aware of the best places to exchange your money. While …
Read Article
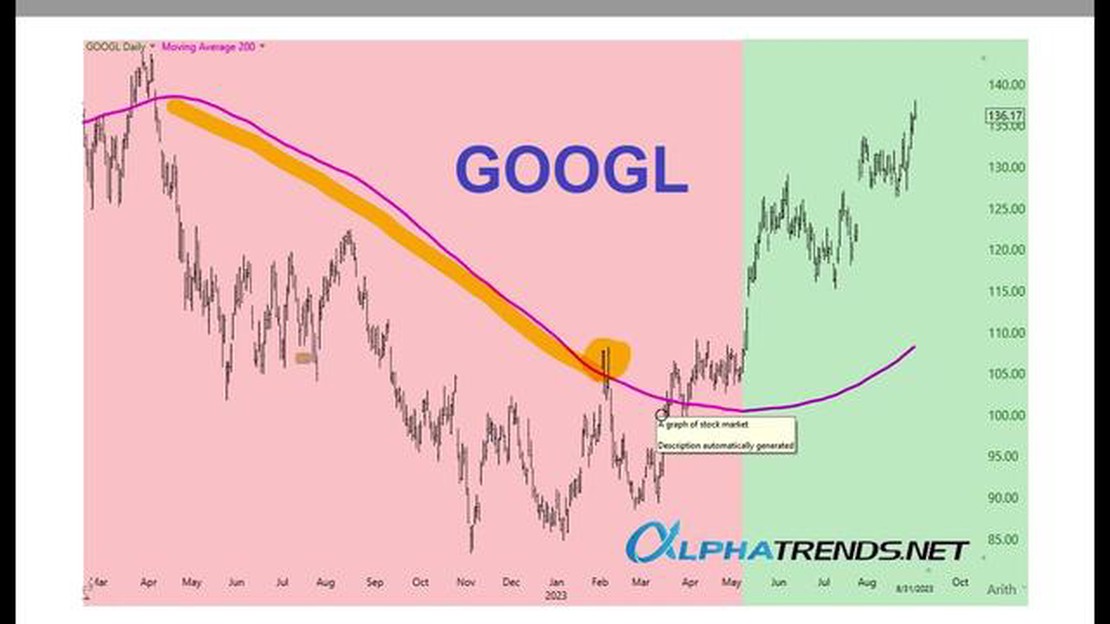
When it comes to analyzing stock market trends and making informed investment decisions, one of the most widely-used indicators is the Exponential Moving Average (EMA) 200 Day Moving Average. This technical analysis tool helps traders and investors determine the overall long-term trend of a stock or an index. Understanding how the EMA 200 Day Moving Average works is essential for anyone looking to navigate the complex world of financial markets.
The EMA 200 Day Moving Average is calculated by taking the average price of a security over the past 200 trading days, with more weight given to the most recent price action. This moving average is considered a reliable measure of a stock’s or an index’s long-term trend, as it smoothens out short-term fluctuations and noise in the market. Traders and investors use the EMA 200 Day Moving Average to identify support and resistance levels, as well as potential entry and exit points for their trades.
One of the primary advantages of the EMA 200 Day Moving Average is its ability to provide a clear and objective view of a stock’s or an index’s overall trend. By focusing on a longer timeframe, traders and investors can filter out the noise and distinguish between temporary price fluctuations and significant market movements. This helps them make more informed decisions and avoid getting caught up in short-term market volatility.
Moreover, the EMA 200 Day Moving Average can act as a psychological support or resistance level. When a stock or an index is trading above its EMA 200 Day Moving Average, it is often seen as a bullish signal, indicating that the market sentiment is positive. On the other hand, if a stock or an index breaks below its EMA 200 Day Moving Average, it may signal a bearish trend and a potential shift in market sentiment.
In conclusion, understanding the EMA 200 Day Moving Average is crucial for traders and investors looking to navigate the complex world of financial markets. By analyzing this long-term trend indicator, market participants can make more informed decisions, identify potential entry and exit points, and avoid getting caught up in short-term market fluctuations. Whether you are a beginner or an experienced trader, incorporating the EMA 200 Day Moving Average into your analysis can significantly enhance your trading strategy and improve your chances of success.
The EMA 200 Day Moving Average is a powerful tool that traders and investors use to analyze and predict the direction of a stock’s price. It is a mathematical calculation that takes into account the price of a security over a specific period of time, with more recent prices given more weight than older prices.

The EMA 200 Day Moving Average is important because it helps traders and investors identify long-term trends in the market. By looking at the average price of a stock over a 200-day period, they can see whether the stock is in an uptrend, downtrend, or trading sideways. This information can be crucial for making informed trading and investment decisions.
In addition to providing insight into the overall trend of a stock, the EMA 200 Day Moving Average can also act as a support or resistance level. If the stock’s price is trading above the EMA 200, it can act as a support level, with buyers stepping in to buy the stock when it reaches this level. On the other hand, if the stock’s price is trading below the EMA 200, it can act as a resistance level, with sellers stepping in to sell the stock when it reaches this level.
Traders and investors also use the EMA 200 Day Moving Average to generate trading signals. For example, if the stock’s price crosses above the EMA 200, it can be seen as a bullish signal, indicating that the stock may be poised for an uptrend. Conversely, if the stock’s price crosses below the EMA 200, it can be seen as a bearish signal, indicating that the stock may be poised for a downtrend.
Overall, the EMA 200 Day Moving Average is an important tool for traders and investors because it provides valuable information about the overall trend of a stock, acts as a support or resistance level, and generates trading signals. By incorporating this indicator into their analysis, traders and investors can make more informed decisions and potentially increase their chances of success in the market.
Read Also: ETF for Euro Currency: Your Guide to Euro ETFs
The Exponential Moving Average (EMA) is one of the most popular technical indicators used by traders and investors to analyze stock price trends. The EMA 200 Day Moving Average specifically is a highly regarded gauge of long-term price momentum. It is calculated by averaging the closing prices of the last 200 trading days, giving more weight to recent data points.
Traders find several benefits to using the EMA 200 Day Moving Average:
Read Also: Malaysia Foreign Reserves: An In-Depth Overview of the Current Figures
| 1. Trend identification: | The EMA 200 Day Moving Average helps identify the overall direction of the stock’s price trend. Traders can use it to determine whether the trend is bullish (upward) or bearish (downward). This information is crucial for making informed trading decisions. |
| 2. Support and resistance levels: | The EMA 200 Day Moving Average often acts as a support and resistance level. When the price is above the EMA, it tends to provide support, indicating that the stock might continue to rise. Conversely, when the price is below the EMA, it can act as resistance, suggesting that the stock may struggle to move higher. |
| 3. Entry and exit points: | Traders can use the EMA 200 Day Moving Average to determine optimal entry and exit points for their trades. For example, they may choose to buy when the price crosses above the EMA and sell when the price crosses below it. This strategy can help traders capture profits and minimize losses. |
| 4. Long-term trend confirmation: | The EMA 200 Day Moving Average is particularly useful for confirming long-term trends. Traders can use it in conjunction with other technical indicators to gain a comprehensive understanding of the stock’s price movement. This can help them make more accurate predictions and increase their chances of success in the market. |
In conclusion, the EMA 200 Day Moving Average offers multiple benefits for traders. It aids in trend identification, acts as support and resistance levels, helps determine entry and exit points, and confirms long-term trends. Traders can leverage these advantages to make informed decisions and improve their trading strategies.
The EMA 200 day moving average is a technical indicator used by traders and investors to analyze the long-term trend of a security. It is calculated by taking the average closing price of a security over the past 200 trading days, giving more weight to the most recent prices. This moving average helps identify the overall direction of the market and is often used to determine support and resistance levels.
The EMA 200 day moving average differs from the simple moving average in the way it calculates the average. While the simple moving average gives equal weight to each price point, the EMA 200 day moving average places more weight on recent prices and gives less importance to older data. This makes the EMA more responsive to recent price changes and helps traders and investors identify trends more quickly.

The EMA 200 day moving average is considered significant because it represents a long-term trend of a security. Many traders and investors use this moving average as a key indicator to identify major trend changes and make trading decisions. When prices are above the EMA 200 day moving average, it is generally considered bullish, while prices below the average are considered bearish.
Traders and investors can use the EMA 200 day moving average in a variety of ways. Some use it as a signal to buy or sell when the price crosses above or below the moving average. Others use it as a tool to confirm the overall trend of a security. Additionally, traders can use the EMA 200 day moving average to determine support and resistance levels, as the moving average often acts as a line of defense for the price.
While the EMA 200 day moving average is a widely used technical indicator, it does have some limitations. Firstly, it may not work well in choppy or sideways markets, as the moving average tends to generate false signals. Additionally, it can be lagging during periods of rapid price movements, as it gives more weight to older data. Traders and investors should use the EMA 200 day moving average in conjunction with other indicators and analysis tools for better decision making.
EMA stands for Exponential Moving Average. It is a type of moving average that gives more weight to recent price data, making it more responsive to current market conditions.

Where to Exchange Money in Turkey If you are planning a trip to Turkey, it is important to be aware of the best places to exchange your money. While …
Read Article
Understanding Non-Qualified Stock Options and Their Mechanics Non-Qualified Stock Options (NQSOs) are a type of stock option granted to employees as a …
Read Article
Calculating Options: A Comprehensive Guide Options are a popular investment vehicle that allows investors to speculate on the future price movements …
Read Article
Are binary options still available for trading? Binary options, a type of financial option in which the payoff is either a fixed amount of some asset …
Read Article
Methods of Moving Averages When it comes to analyzing data, moving averages are an essential tool in any statistician’s arsenal. This comprehensive …
Read Article
Best Currencies Comparable to SGD The Singapore Dollar (SGD) is the official currency of Singapore, and it is one of the strongest currencies in the …
Read Article

