


Understanding the Tax Implications of Vested Shares in Australia
Do I pay tax on vested shares in Australia? Vested shares are a common form of employee remuneration in Australia. As employees work for a company, …
Read Article
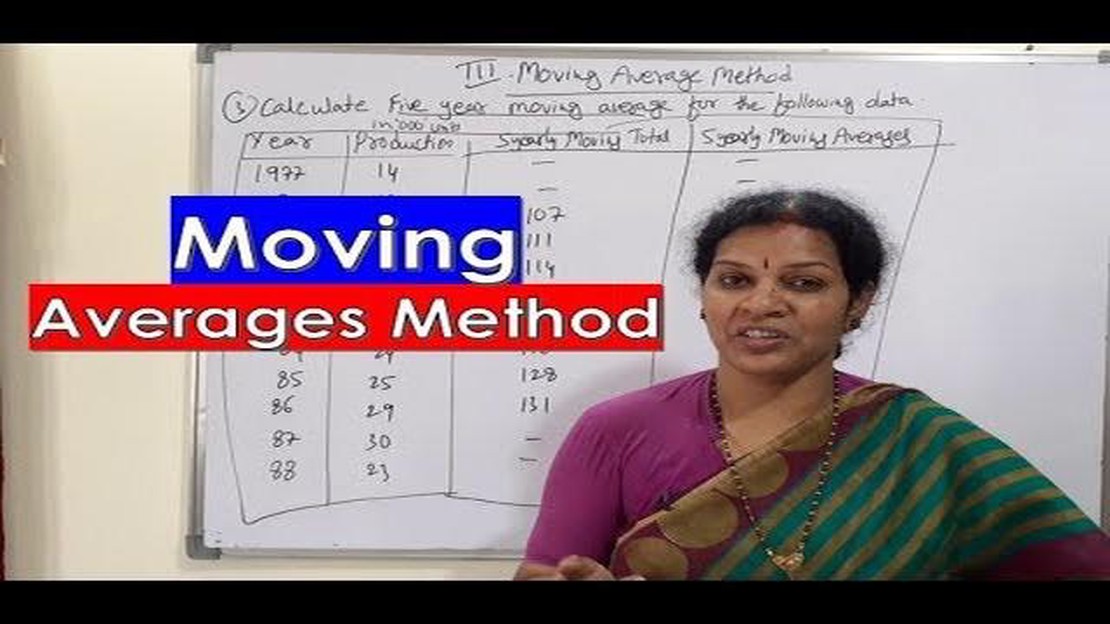
When it comes to analyzing data, moving averages are an essential tool in any statistician’s arsenal. This comprehensive guide will walk you through the various methods of calculating moving averages and how they can be applied to different data sets.
What is a moving average?
A moving average is a calculation used to analyze data points by creating a series of averages over a specific period of time. This is done by taking the average of a set number of data points and then shifting the window of calculation forward one data point at a time.
Simple Moving Average (SMA)
The Simple Moving Average (SMA) is the most basic method of calculating a moving average. It involves taking the sum of a set number of data points and dividing it by the number of points in the set. This method gives equal weight to each data point in the calculation.
Weighted Moving Average (WMA)
The Weighted Moving Average (WMA) is a method of calculating a moving average that assigns weights to each data point. This means that some data points have more influence on the calculation than others. The weights are typically determined by the analyst based on their assessment of the data.
Exponential Moving Average (EMA)
The Exponential Moving Average (EMA) is a type of weighted moving average that gives more weight to recent data points. This is achieved by assigning exponentially decreasing weights to each data point. The EMA is especially useful for identifying trends and is commonly used in technical analysis of financial markets.

By understanding the different methods of calculating moving averages and their applications, you can enhance your ability to analyze and interpret data. Whether you’re a researcher, statistician, or investor, mastering these techniques can greatly improve your decision-making process.
In conclusion, moving averages are a powerful tool for analyzing data. They provide a smooth and visually appealing representation of trends and can be applied to a wide range of data sets. By familiarizing yourself with the different methods of calculating moving averages, you can gain valuable insights and make more informed decisions based on the data at hand.
In financial analysis, moving averages are commonly used to analyze and forecast trends. A moving average is a statistical calculation used to analyze a series of data points by creating a sequence of averages of different subsets of the full data set. It is called a “moving” average because as new data points become available, the average is recalculated by “moving” the window or subset of data being averaged.
Moving averages are often used to smooth out short-term fluctuations and highlight longer-term trends or patterns. They are commonly used in price analysis of financial instruments, such as stocks, currencies, and commodities.
Read Also: What is an FX Trader?
There are different types of moving averages, including simple moving averages (SMA), exponential moving averages (EMA), and weighted moving averages (WMA). Each type has its own calculation method and characteristics that make it suitable for different analysis techniques and time periods.
A simple moving average calculates the average of a specified number of data points by summing them and then dividing by the number of points. This type of moving average provides equal weight to all data points and is easy to calculate.
An exponential moving average gives more weight to recent data points, making it more responsive to price changes. It is calculated using a formula that assigns a higher weight to the most recent data points.
A weighted moving average assigns different weights to each data point, typically based on their proximity to the present. This type of moving average can be useful when certain data points are considered to be more important or relevant than others.
Overall, moving averages are widely used in technical analysis to identify trends, support and resistance levels, and potential buy or sell signals. They provide a valuable tool for traders and investors to make informed decisions based on historical price data.
Moving averages are a key tool in technical analysis for stock market traders and investors. They are used to identify trends, determine support and resistance levels, and generate buy or sell signals. The importance of moving averages lies in their ability to smooth out price fluctuations and provide a clear picture of the overall direction of an asset’s price movement.
Read Also: Exploring Options Trading with Real-Life Examples
One of the main benefits of using moving averages is their ability to filter out noise in price data. By calculating the average price over a specific period of time, moving averages help traders focus on the general trend rather than short-term price movements. This can be especially useful in volatile markets where prices can fluctuate wildly from one day to the next.
Another important aspect of moving averages is their ability to act as dynamic support and resistance levels. When an asset’s price is above its moving average, it is considered to be in an uptrend and the moving average acts as a support level. Conversely, when the price is below the moving average, it is in a downtrend and the moving average acts as a resistance level. These levels can provide valuable information for traders looking to enter or exit positions.
Moving averages can also be used to generate buy or sell signals. For example, a common strategy is to use a shorter-term moving average, such as the 50-day moving average, in combination with a longer-term moving average, such as the 200-day moving average. When the shorter-term moving average crosses above the longer-term moving average, it is seen as a bullish signal, indicating that it may be a good time to buy. Conversely, when the shorter-term moving average crosses below the longer-term moving average, it is seen as a bearish signal, indicating that it may be a good time to sell.
In conclusion, moving averages are a valuable tool for traders and investors in the stock market. They help smooth out price fluctuations, identify trends, determine support and resistance levels, and generate buy or sell signals. By using moving averages effectively, traders can make more informed decisions and improve their overall trading performance.

A moving average is a statistical calculation that is used to analyze data over a certain period of time. It is called a moving average because it continuously updates as new data points become available.
Moving averages are important in data analysis because they help to smooth out short-term fluctuations in the data, making it easier to identify long-term trends.
There are several different types of moving averages, including the simple moving average (SMA), the exponential moving average (EMA), and the weighted moving average (WMA).
The simple moving average is calculated by taking the sum of all data points over a certain period of time and dividing it by the number of data points.
The main difference between a simple moving average (SMA) and an exponential moving average (EMA) is that the EMA gives more weight to recent data points, making it more responsive to changes in the data.
There are several types of moving averages, including simple moving averages, weighted moving averages, and exponential moving averages. Each type has its own calculation method and is used for different purposes.
A simple moving average is calculated by adding up a specified number of prices and dividing the sum by the number of prices. For example, a 5-day simple moving average would be calculated by adding up the prices of the last 5 days and dividing by 5.

Do I pay tax on vested shares in Australia? Vested shares are a common form of employee remuneration in Australia. As employees work for a company, …
Read Article
Where can I find forex signals? Are you a beginner in forex trading and looking for ways to maximize your profits? One of the key elements for …
Read Article
Regulation of Forex Trading in South Africa Forex trading is a popular investment option for individuals in South Africa, as it offers the potential …
Read Article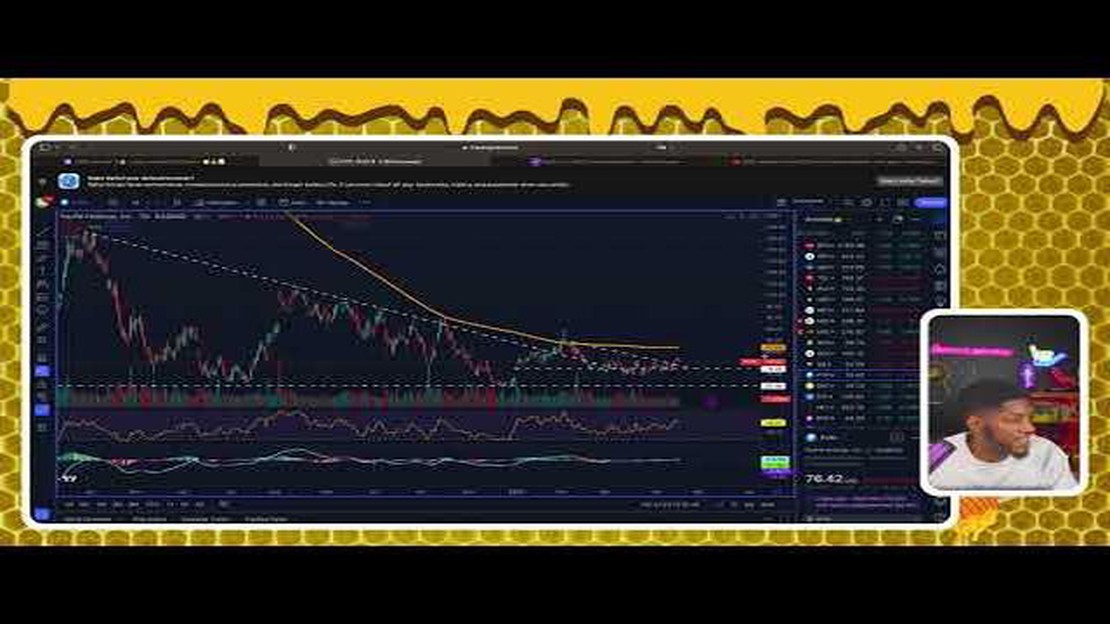
How to create a stock options watchlist Building a stock options watchlist is an essential step for any investor looking to navigate the complex world …
Read Article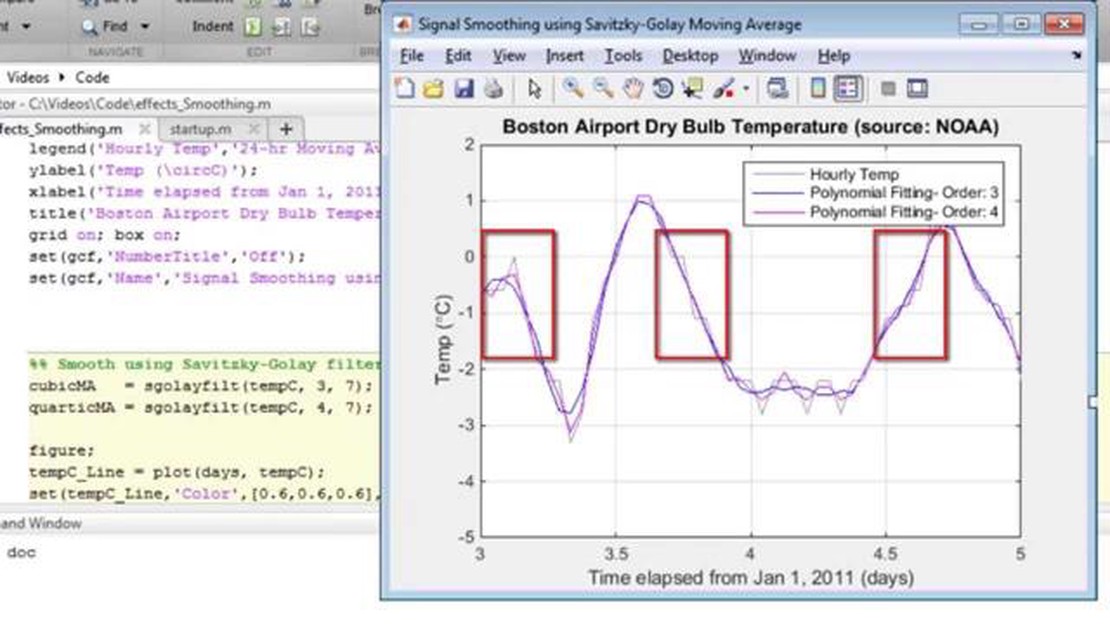
Understanding the Difference between Moving Average and Savitzky-Golay Filter In the field of signal processing, there are various methods used for …
Read Article
Should I Exchange Money in Australia or NZ? When traveling to Australia or New Zealand, one of the most important considerations is how to exchange …
Read Article


