


What is the Success Rate of Trading Bots? Exploring their Accuracy and Performance
What is the success rate of trading bots? In today’s digital age, trading bots have become increasingly popular tools for both amateur and …
Read Article
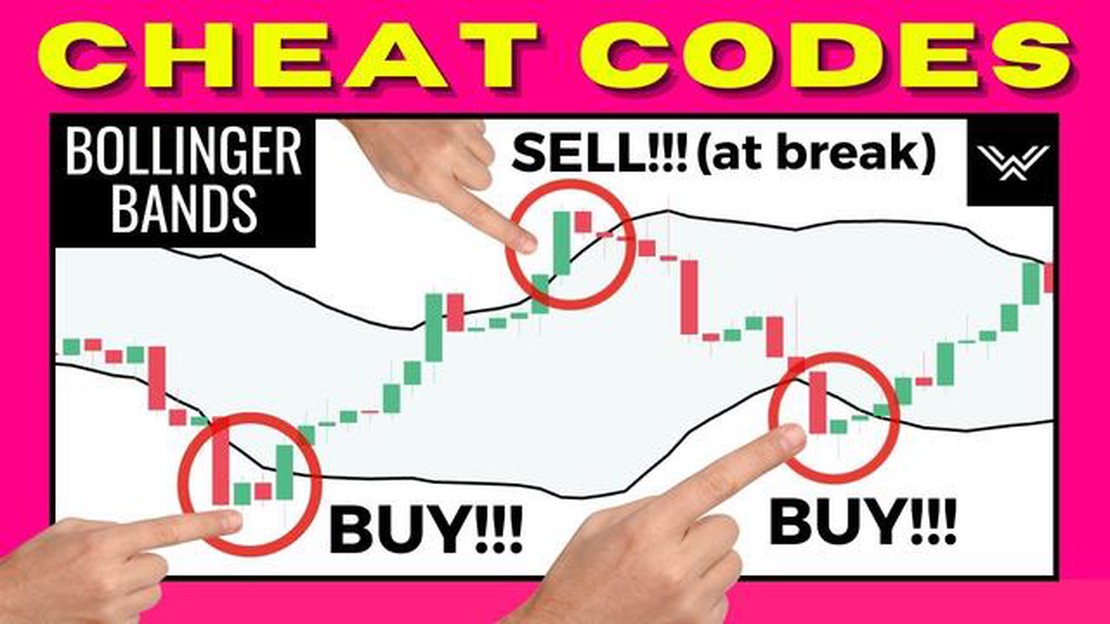
A Bollinger Band is a technical analysis tool that was developed by John Bollinger in the 1980s. It is used to assess the volatility and potential price movements of a financial instrument. The band consists of a central moving average line and two standard deviation lines, one above and one below the moving average.
When the Bollinger Band is tight, it indicates that the price volatility of the instrument is low. This can be seen visually as the upper and lower deviation lines come closer together. This tightening of the band suggests that a significant price movement is imminent.
Traders and investors closely follow the band width, which is a measure of the distance between the upper and lower deviation lines. When the band width is narrow, it signals that the market is consolidating and trading in a range-bound manner. This can be an indication of a period of low market activity.
However, a tight Bollinger Band does not provide a specific directional signal. It simply indicates that a price breakout or trend reversal may occur in the near future. Traders often combine the use of Bollinger Bands with other indicators or chart patterns to confirm the potential price movement and formulate their trading strategies.
In conclusion, a tight Bollinger Band is a useful tool for assessing market volatility and identifying potential price movements. It can be used by traders and investors to anticipate breakouts or reversals in price trends. However, it should be used in conjunction with other technical analysis tools to increase the accuracy of trading decisions.
A tight Bollinger Band refers to a specific configuration of the Bollinger Bands indicator, which is a popular tool used in technical analysis to understand the volatility and potential price movement of a financial instrument.
The Bollinger Bands consist of three lines: the middle band, which is a simple moving average (SMA), and the upper and lower bands, which are calculated based on the standard deviation of the price. The upper band is usually set at two standard deviations above the SMA, while the lower band is set at two standard deviations below.

A tight Bollinger Band occurs when the distance between the upper and lower bands narrows significantly. This indicates a period of low volatility and a potential tightening range for the price action. Traders often interpret a tight Bollinger Band as a sign of an impending breakout, expecting an increase in volatility and a significant price move in either direction.
When the Bollinger Bands contract, it suggests that the market is entering a consolidation phase, with buyers and sellers in equilibrium. This period of consolidation is often followed by a breakout, where the price breaks out of the tight range and starts trending in a specific direction. Traders use a variety of strategies to trade breakouts from tight Bollinger Bands, such as entering a position when the price moves above or below the upper or lower band.
Read Also: Understanding ETS: The Comprehensive Guide to Emission Trading Systems
It’s important to note that a tight Bollinger Band alone is not a reliable signal to enter a trade. Traders should use additional technical indicators, chart patterns, and fundamental analysis to confirm the potential breakout and make informed trading decisions. Additionally, it’s crucial to set appropriate stop-loss orders and risk management strategies to protect against false breakouts and potential losses.
In conclusion, a tight Bollinger Band is a technical indicator that suggests a period of low volatility and potential price consolidation. Traders use this information to anticipate and prepare for potential breakouts and significant price moves. However, it’s essential to use additional analysis and risk management techniques when trading based on a tight Bollinger Band signal.
A Bollinger Band is a technical analysis tool that consists of a middle band (usually a 20-day simple moving average) and two outer bands that are standard deviations away from the middle band. When the outer bands move close together, creating a narrow range, it is known as a tight Bollinger Band.
Interpreting a tight Bollinger Band can provide valuable insight into the future movement of a security. Here are some ways to interpret a tight Bollinger Band:
1. Volatility contraction: A tight Bollinger Band signifies a contraction in volatility. This means that the price range of the security is narrowing, indicating decreased volatility and potentially signaling a period of consolidation or range-bound trading.
2. Potential breakout: A tight Bollinger Band can act as a precursor to a significant price move. When the price breaks out of the tight range, it may indicate the start of a new trend or a continuation of the current trend. Traders often look for a breakout above or below the upper or lower band respectively to confirm a potential trend reversal or continuation.
Read Also: Can you practice trading options? Learn how to gain experience before investing real money
3. Bollinger Band squeeze: When the outer bands move close together, it creates what is known as a Bollinger Band squeeze. This indicates that a period of low volatility is likely to be followed by a period of high volatility. Traders use this squeeze as a signal of an imminent big price move, and they often prepare to enter or exit positions accordingly.
4. Range-bound trading: A tight Bollinger Band can be an indication of range-bound trading, where the price moves within a defined range, bouncing between the upper and lower bands. Range-bound traders may look for opportunities to buy near the lower band and sell near the upper band, taking advantage of price reversals within the range.

It is important to note that a tight Bollinger Band alone is not enough to make trading decisions. It should be used in conjunction with other technical indicators and analysis to confirm potential entry or exit points.
In conclusion, a tight Bollinger Band can provide valuable information about current market conditions and potential future price movements. By understanding how to interpret a tight Bollinger Band, traders can better navigate the markets and make informed trading decisions.
A Bollinger Band is a technical analysis tool that consists of a middle band and two outer bands. The middle band is typically a simple moving average, while the outer bands are derived from the standard deviation of price movements.
Bollinger Bands are used to measure the volatility and potential price reversals in a financial instrument. Traders often look for price breakouts or bounces off the bands to identify potential trading opportunities.
When the Bollinger Bands are tight, it means that the volatility of the financial instrument is low. This typically indicates a period of consolidation or range-bound trading, where the price is staying within a narrow range.
Traders can benefit from a tight Bollinger Band by anticipating a potential breakout or significant price movement. When the price breaks out of the tight range, it can indicate the start of a new trend, providing traders with a trading opportunity.

What is the success rate of trading bots? In today’s digital age, trading bots have become increasingly popular tools for both amateur and …
Read Article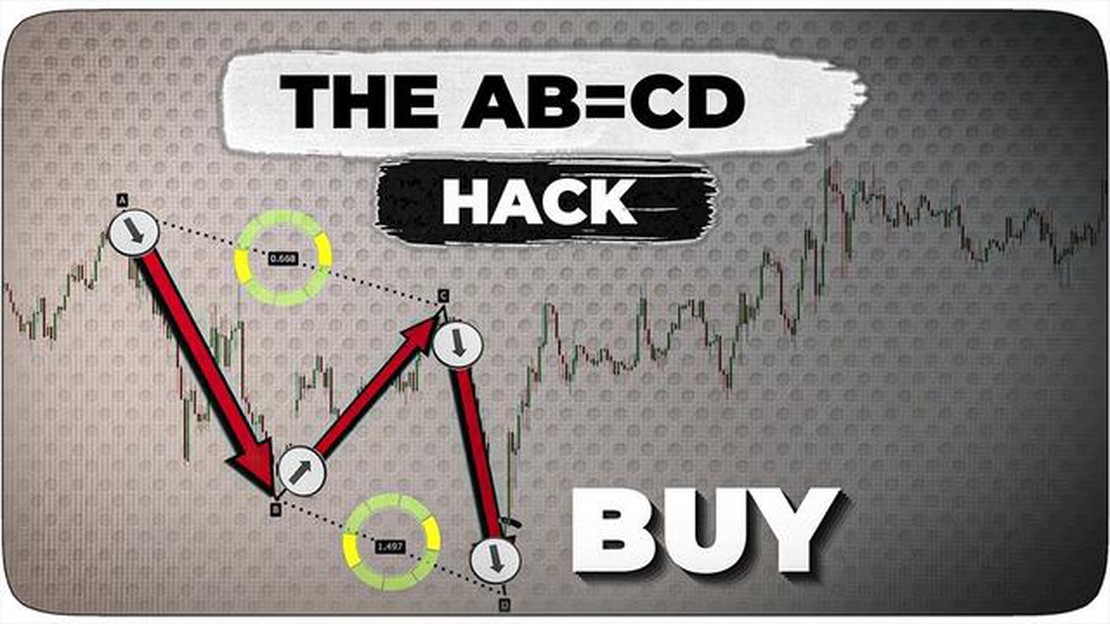
Understanding the ABC Chart Pattern When it comes to technical analysis, chart patterns play a crucial role in predicting future price movements. One …
Read Article
What is the value of Bangladesh’s foreign reserve? As an emerging economy, Bangladesh’s foreign reserve plays a crucial role in the country’s …
Read Article
What happens if I don’t exit on option expiry? Option trading can be an exciting and potentially lucrative way to participate in the financial …
Read Article
Understanding Q in time series analysis When it comes to analyzing time series data, it is important to understand the concept of Q, also known as …
Read Article
Market Rate of SGD to USD: All You Need to Know The market rate of SGD to USD is an important metric for individuals and businesses involved in …
Read Article


