


Is Forex Trading the Future? Understanding the Potential of Forex Trading
Is forex trading the future? Forex trading, also known as foreign exchange trading or currency trading, has gained tremendous popularity in recent …
Read Article
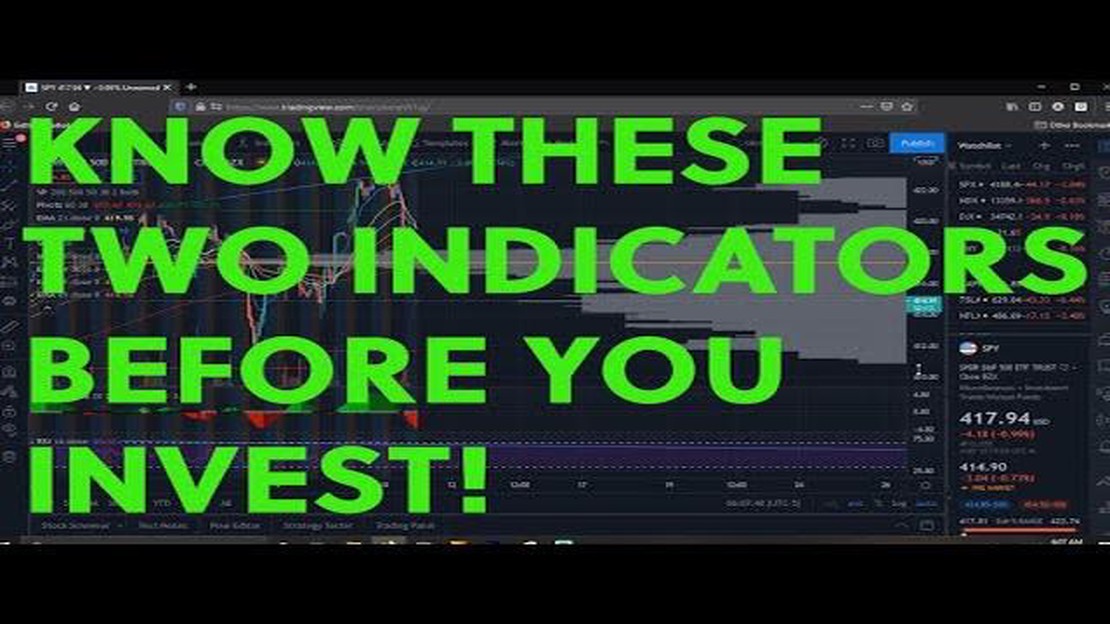
The 21 Exponential Moving Average (EMA) is a popular technical analysis tool used by traders to identify trends and potential entry and exit points in the stock market. This indicator is particularly valuable as it gives more weight to recent price data, making it more responsive to current market conditions compared to other moving average indicators.
Locating the 21 EMA on a chart is a straightforward process that can be done using any reputable trading platform or charting software. To begin, open a price chart for the desired financial instrument, whether it’s a stock, index, currency pair, or commodity. Most platforms offer a variety of chart types, such as line charts, candlestick charts, and bar charts. Choose the chart type that suits your preferences and trading style.
Once you have a chart open, search for the indicator or drawing tools menu. In many platforms, this menu is located at the top of the chart or in a toolbar on the side. Look for the option to add a moving average or EMA to your chart. Click on this option, and a dialog box or settings menu will appear.
In the dialog box or settings menu, you will need to specify the parameters for the moving average. In this case, choose the Exponential Moving Average (EMA) and set the period to 21. This means the indicator will calculate the average price over the past 21 periods, which could be 21 days, 21 hours, or 21 minutes depending on the chosen time frame.
After selecting the appropriate settings, click on the “Apply” or “OK” button, and the 21 EMA will appear on your chart. The line will be plotted based on the closing prices of the chosen time frame, and it will adjust and move as new data becomes available. Traders often use the 21 EMA as a dynamic support or resistance level, placing trades based on price interactions with this indicator.
In conclusion, the 21 EMA is a powerful tool for traders looking to identify trends and potential entry or exit points in the market. By following these step-by-step instructions, you can easily locate and apply the 21 EMA on your charting platform. Remember to practice and experiment with different time frames and strategies to find what works best for your trading style and goals.
The 21-day Exponential Moving Average (EMA) is a popular technical indicator used by traders to identify trends in the financial markets. It is commonly used to determine the direction of the market and can be a valuable tool for making trading decisions. In this comprehensive guide, we will cover step-by-step instructions on how to find the 21 EMA.
Step 1: Choose a Financial Charting Platform
To find the 21 EMA, you will need access to a financial charting platform. There are several platforms available that provide free or paid access to real-time financial data. Some popular options include TradingView, MetaTrader, and ThinkorSwim. Choose a platform that suits your needs and sign up for an account.
Step 2: Select the Desired Financial Instrument
Once you have access to a charting platform, select the financial instrument you want to analyze. This can be a stock, currency pair, or any other asset that is available on the platform. Make sure the asset is actively traded and has sufficient historical data for accurate analysis.

Step 3: Apply the Exponential Moving Average Indicator
After selecting the desired financial instrument, locate the indicators section on your charting platform. Look for the EMA indicator and apply it to the chart. Once applied, you will need to customize the parameters to set the period to 21. The period represents the number of days used in the calculation of the EMA.
Read Also: Forex Factory Hours: A Guide to Trading Hours and Sessions
Step 4: Interpret the 21 EMA
Once the 21 EMA is applied to the chart, it will appear as a line that oscillates above or below the price. When the price is above the 21 EMA line, it is generally considered a bullish signal, indicating an uptrend. Conversely, when the price is below the 21 EMA line, it is often considered a bearish signal, indicating a downtrend.
Step 5: Use the 21 EMA in Your Trading Strategy
Now that you know how to find the 21 EMA, you can incorporate it into your trading strategy. Many traders use the 21 EMA as a tool for determining entry and exit points in the market. For example, a trader might enter a long position when the price crosses above the 21 EMA and exit the position when the price crosses below the 21 EMA.
Conclusion
The 21 EMA is a versatile technical indicator that can help traders identify trends and make informed trading decisions. By following the step-by-step guide outlined above, you can easily find and apply the 21 EMA to your charts. However, it is important to remember that no indicator is foolproof, and it should be used in conjunction with other technical analysis tools for a comprehensive trading strategy.
Read Also: What does GBP JPY correlate with? Understanding the correlation of British pound and Japanese yen
EMA, or Exponential Moving Average, is a widely used technical analysis tool that helps traders identify trends and make informed trading decisions. Among the various EMAs, the 21 EMA holds significant importance for many traders.
The 21 EMA is calculated by taking the average closing price of an asset over the past 21 periods and giving more weight to the recent prices. This means that each day, the oldest closing price is dropped, and the newest closing price is added to the calculation. This way, the 21 EMA is continuously updated and reflects the current price action.

Traders often use the 21 EMA to gauge the strength and direction of a trend. When the price is above the 21 EMA, it indicates an uptrend, while a price below the 21 EMA suggests a downtrend. The slope of the 21 EMA also provides valuable information about the momentum of the trend. A steep slope indicates a stronger trend, while a flat or shallow slope indicates a weaker trend.
Furthermore, the 21 EMA can serve as a dynamic support or resistance level. During an uptrend, the 21 EMA can act as a support level, where traders might consider buying opportunities when the price touches or bounces off the 21 EMA. Conversely, during a downtrend, the 21 EMA can act as a resistance level, where traders might look for selling opportunities.
Many traders use the 21 EMA in combination with other technical indicators or chart patterns to make more accurate trading decisions. For example, they might wait for a bullish or bearish crossover between the 21 EMA and another shorter-term EMA before entering a trade. Additionally, they might look for other signals such as candlestick patterns, volume analysis, or trendline breaks to confirm the potential trading opportunity.
In conclusion, the 21 EMA is a powerful tool that helps traders identify trends, determine support and resistance levels, and make informed trading decisions. Understanding the importance of the 21 EMA can enhance your technical analysis skills and improve your chances of success in the financial markets.
The 21 EMA, or the 21-day Exponential Moving Average, is an indicator used in technical analysis to track the average price of a financial instrument over a 21-day period. It is important in trading because it helps identify trends and potential entry or exit points for traders.
To calculate the 21 EMA, you need to first select a time period (in this case, 21 days). Then, add up the closing prices of the financial instrument for the past 21 days and divide the sum by 21. This will give you the average price for the 21-day period. To calculate the EMA, you will need to use a formula that gives more weight to the most recent prices.
There are many popular trading platforms that allow you to add the 21 EMA indicator, such as MetaTrader, ThinkorSwim, and TradingView. These platforms offer a wide range of technical indicators and tools that can help enhance your trading strategies.
To use the 21 EMA to identify trends, you can plot the indicator on a price chart and observe the direction of the EMA line. If the EMA is sloping upwards, it indicates an uptrend, while a downwards sloping EMA indicates a downtrend. You can also look for crossovers between the EMA and the price chart to confirm the trend.
Yes, the 21 EMA can be used for short-term trading. Traders can use the EMA to identify short-term trends and potential entry or exit points. By combining the 21 EMA with other technical indicators and tools, traders can develop effective short-term trading strategies.
The 21 EMA refers to the 21 Exponential Moving Average, which is a technical indicator used by traders to analyze price trends in financial markets.

Is forex trading the future? Forex trading, also known as foreign exchange trading or currency trading, has gained tremendous popularity in recent …
Read Article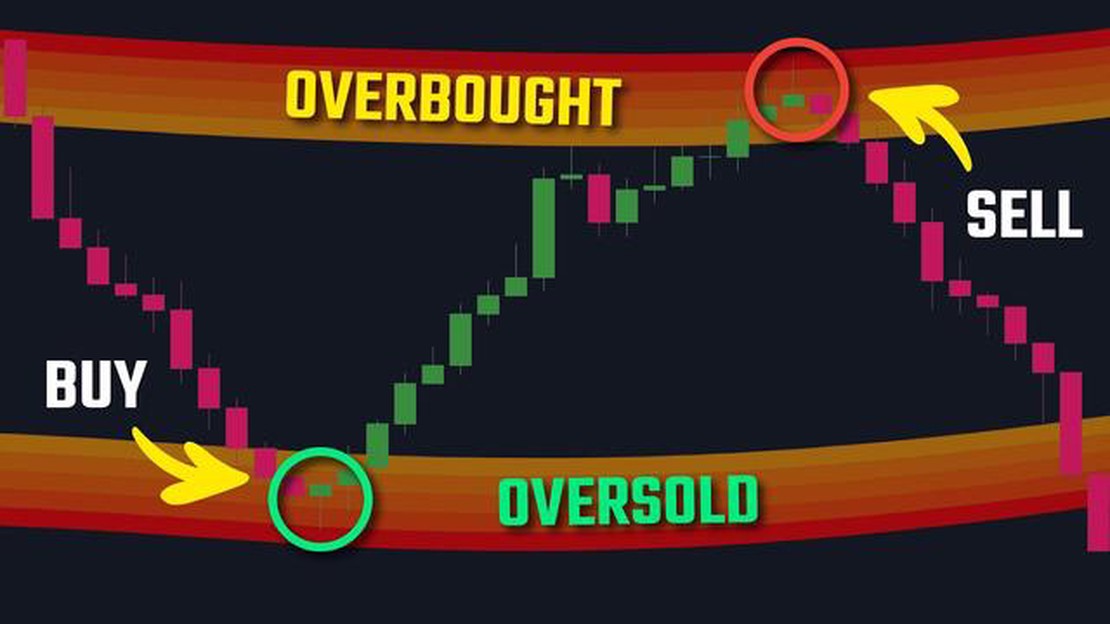
Does overbought mean a reversal? When trading in the financial markets, understanding market indicators is crucial for making informed decisions. …
Read Article
Understanding ETF Taxation: A Comprehensive Guide Exchange-traded funds (ETFs) have become increasingly popular investment vehicles in recent years, …
Read Article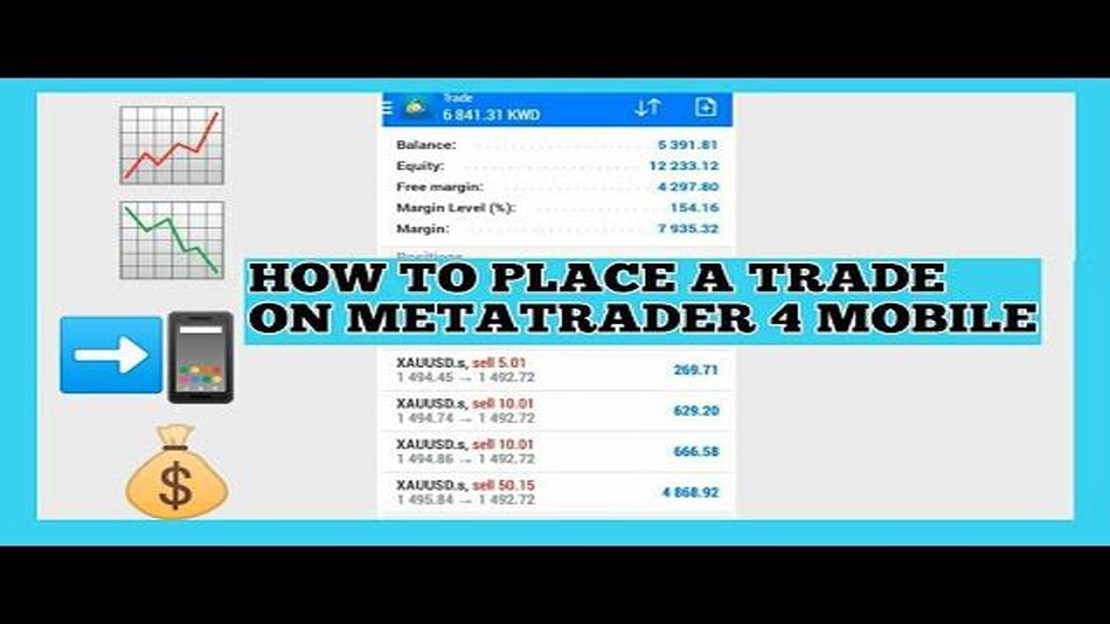
How to Place an Order on MT4 Trading on the MetaTrader 4 (MT4) platform is a popular choice for many traders due to its user-friendly interface and …
Read Article
Where can I get a list of penny stocks? Penny stocks are an attractive investment option for many investors due to their low price and potential for …
Read Article
Convert 100,000 USD to HKD Are you planning a trip to Hong Kong and wondering how much your 100,000 USD is worth in HKD? Look no further! We’ve got …
Read Article


