


Exchange Rate of Euro and Dollar: Latest Updates and Predictions
Exchange Rate of the Euro and the Dollar: Latest Updates and Analysis The exchange rate of the euro and dollar has always been a hot topic among …
Read Article
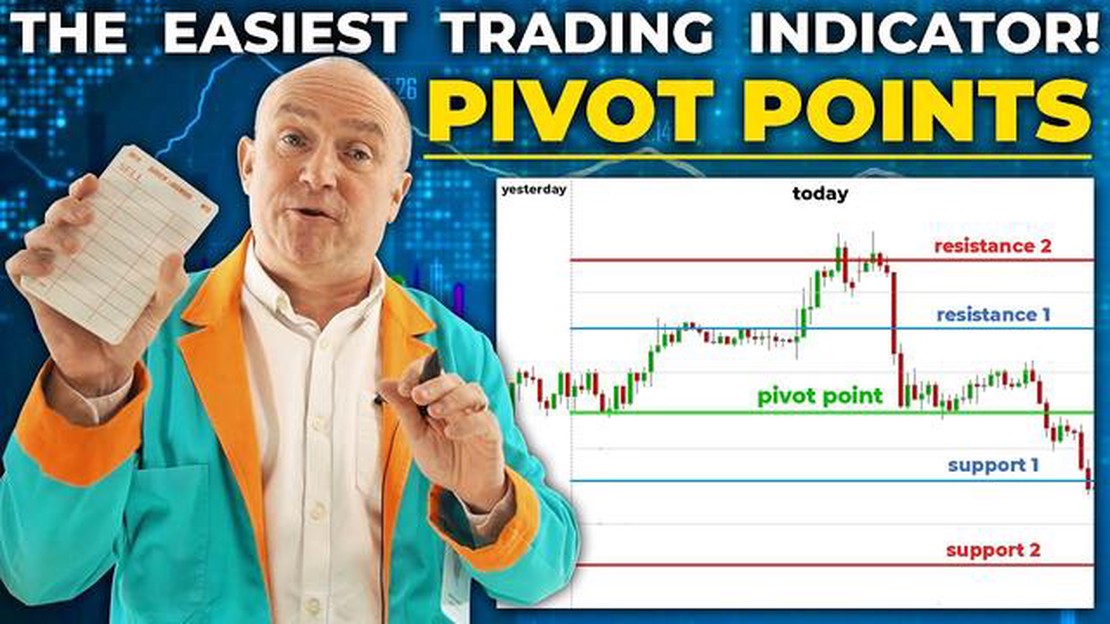
Pivot Point is a popular technical analysis tool used by traders and investors to identify potential price reversals and determine market trends. It is a mathematical calculation that helps to predict the future direction of an asset’s price movement. The Pivot Point is a significant level that is calculated based on the previous day’s high, low, and closing prices.
Technical analysts believe that the price tends to react around the Pivot Point levels, and these levels act as support and resistance levels in the market. When the price moves above the Pivot Point, it is considered bullish, and when it moves below the Pivot Point, it is considered bearish. Traders use Pivot Points to identify potential entry and exit points, as well as to set stop-loss and take-profit levels.
However, the reliability of Pivot Points as an indicator in technical analysis has been a subject of debate among traders and analysts. Some argue that Pivot Points accurately predict price reversals and serve as reliable entry and exit points. They believe that when the price reaches a Pivot Point level, it is likely to reverse or consolidate, providing profitable trading opportunities.
On the other hand, skeptics argue that Pivot Points are based on historical data and do not take into account other influential factors such as market news, economic events, and investor sentiment. They argue that relying solely on Pivot Points without considering these factors can lead to false signals and ineffective trading decisions.
Ultimately, the effectiveness of Pivot Points as a reliable indicator in technical analysis depends on the trader’s understanding of its limitations and their ability to combine it with other analysis tools and strategies. While Pivot Points can provide valuable insights into price movements, it is essential for traders to exercise caution and consider multiple factors when making trading decisions.
Pivot point is a widely used technical indicator in the field of technical analysis. It is commonly used by traders and investors to determine potential support and resistance levels in the market. However, the reliability of pivot point as an indicator is a topic of debate among market participants.

Advocates of pivot point argue that it can be a useful tool in identifying key levels in the market. By calculating the pivot point, combined with the high, low, and close prices of the previous period, traders can identify potential areas of interest. These levels can act as support or resistance, guiding traders in making decisions about entry and exit points.
On the other hand, critics argue that pivot point is a lagging indicator and may not accurately predict future price movements. They argue that the markets are dynamic and constantly changing, and relying solely on pivot point may lead to false signals. They suggest that traders should use pivot point in conjunction with other technical indicators and tools to confirm their analysis.
Ultimately, the effectiveness of pivot point as an indicator depends on the trader’s strategy, risk tolerance, and market conditions. Some traders may find pivot point to be a reliable tool in their trading arsenal, while others may prefer to rely on other indicators. It is important for traders to thoroughly test and evaluate the effectiveness of pivot point in their own trading before making any decisions.
In conclusion, pivot point can be a useful tool in technical analysis, but its reliability as an indicator is subjective. Traders should consider their own trading style and preferences, as well as market conditions, when determining whether to use pivot point in their analysis.
Technical analysis is a popular approach used by traders and investors to make decisions based on historical price data and various indicators. One such indicator is the pivot point, which is widely used to identify potential support and resistance levels in the market.
The pivot point is a simple yet powerful tool that is calculated based on the previous day’s high, low, and close prices. It provides traders with key levels to monitor, such as the pivot point itself, as well as the support levels below and resistance levels above.
Read Also: Understanding the Moving Average Cloud Indicator in Tradingview - A Comprehensive Guide
Although the pivot point indicator has been used for decades, its effectiveness in technical analysis remains a subject of debate among traders. Some argue that pivot points can accurately predict price movements and serve as reliable entry and exit points. Others believe that pivot points are often subjective and prone to manipulation, making them less effective in practice.
Proponents of pivot points argue that the indicator works well in trending markets, where it can provide clear support and resistance levels. It is especially useful in conjunction with other technical analysis tools, such as trendlines, moving averages, and oscillators.
Read Also: Discover the Origins of Forex Trading: A Brief History
On the other hand, critics of pivot points claim that the indicator is based solely on historical data and does not take into account fundamental factors, news events, or market sentiment. As a result, pivot points may be less effective in volatile or news-driven markets, where unexpected developments can quickly invalidate the predicted levels.
Despite the ongoing debate, many traders continue to rely on pivot points as part of their technical analysis toolkit. They view the indicator as a valuable tool for identifying potential turning points, setting stop-loss and take-profit levels, and managing risk.
Ultimately, the effectiveness of the pivot point indicator in technical analysis may vary depending on the trader’s strategy, risk tolerance, and market conditions. It is important for traders to understand the limitations and potential drawbacks of using pivot points and to consider them in conjunction with other indicators and analysis techniques.
Overall, further research and analysis are needed to determine the true effectiveness of pivot points in technical analysis. Traders should continuously evaluate and adapt their strategies based on empirical evidence and real-time market observations.
A pivot point is a technical indicator used in technical analysis to determine potential support and resistance levels for a given security or asset. It is calculated based on the previous day’s high, low, and closing prices.
A pivot point is calculated by adding the previous day’s high, low, and closing prices and dividing the sum by 3. This calculation provides the pivot point, from which various support and resistance levels can be derived.

The reliability of pivot points as indicators in technical analysis can vary. Some traders and analysts believe that pivot points can accurately identify levels of support and resistance, while others may argue that they are less effective in certain market conditions or for specific assets.
One advantage of using pivot points is that they provide predefined levels of support and resistance, which can be useful for setting entry and exit points in trading strategies. Pivot points can also help traders identify potential price reversals or breakout opportunities.
One limitation of using pivot points is that they are based on historical data and may not accurately reflect current market conditions or future price movements. Additionally, pivot points are widely known and used, which can lead to crowded trades and potentially reduced effectiveness.
A pivot point is a technical indicator used in technical analysis to determine potential price levels of an asset based on its previous high, low, and close prices. It is used to identify important support and resistance levels in the market.

Exchange Rate of the Euro and the Dollar: Latest Updates and Analysis The exchange rate of the euro and dollar has always been a hot topic among …
Read Article
Backdating Stock Options: Understanding the Illegality Behind It Backdating stock options is a practice that involves retroactively changing the date …
Read Article
How much USD can I carry from Hong Kong? Traveling to Hong Kong and wondering how much US dollars you can carry with you? Understanding the currency …
Read Article
Understanding the Difference Between Qualified and Nonqualified ISO: Key Factors to Consider An ISO (Incentive Stock Option) is a type of employee …
Read Article
Is Intraday Trading Profitable in Forex? Intraday trading, also known as day trading, has become increasingly popular in the Forex market. Traders are …
Read Article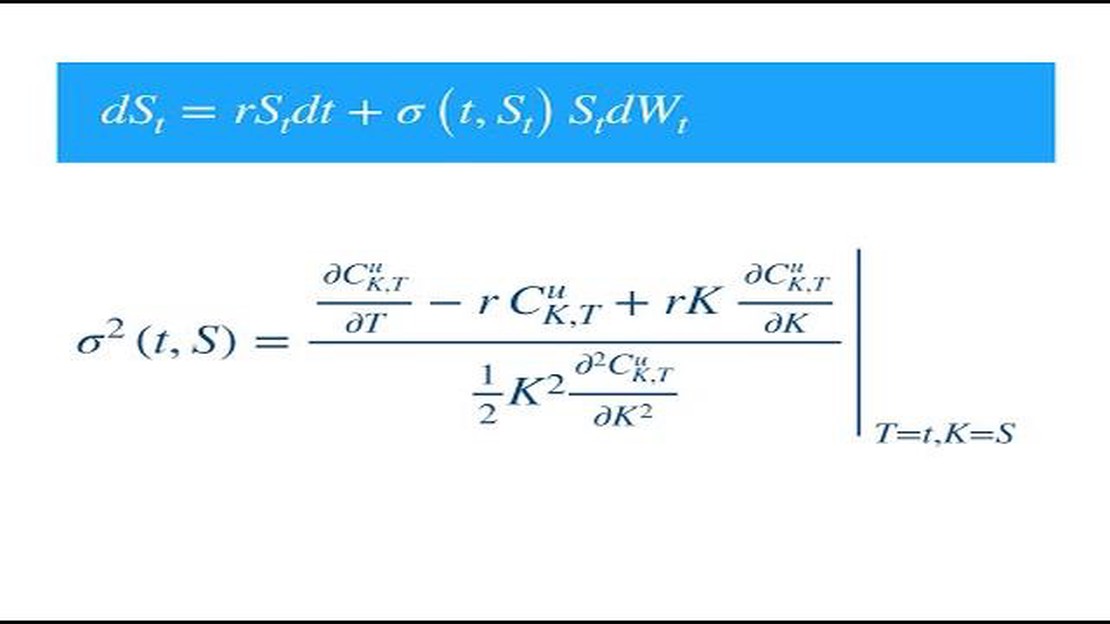
Exploring the Formula for Stochastic Volatility Model In the world of finance, understanding and predicting volatility is crucial for making informed …
Read Article


